


The index is hovering now around the 200 SMA area at H1 chart, looking to develop more bullish patterns across the board. However, USDX didn't manage to break above the key resistance level of 101.76, in a move that could open the doors to test the 102.46 level. If the support area of 101.03 gives up today, then another test of the 100.00 handle is likely to happen.
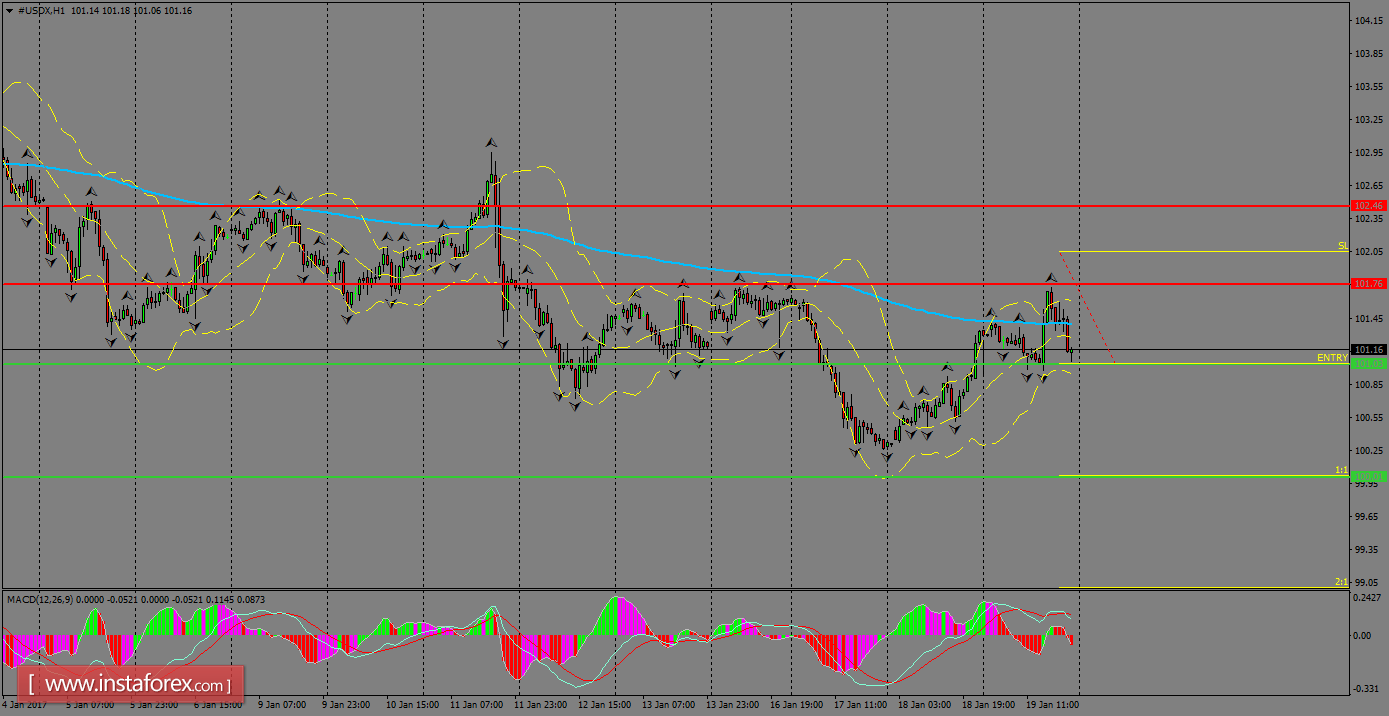
H1 chart's resistance levels: 101.06 / 101.76
H1 chart's support levels: 101.03 / 100.00
Trading recommendations for today: Based on the H1 chart, place sell (short) orders only if the USD Index breaks with a bearish candlestick; the support level is at 101.03, take profit is at 100.00 and stop loss is at 102.05.


