Main Quotes Calendar Forum
flag

FX.co ★ Technical analysis of gold for January 20, 2017

parent
Forex Analysis:::2017-01-20T07:57:14

Technical analysis of gold for January 20, 2017

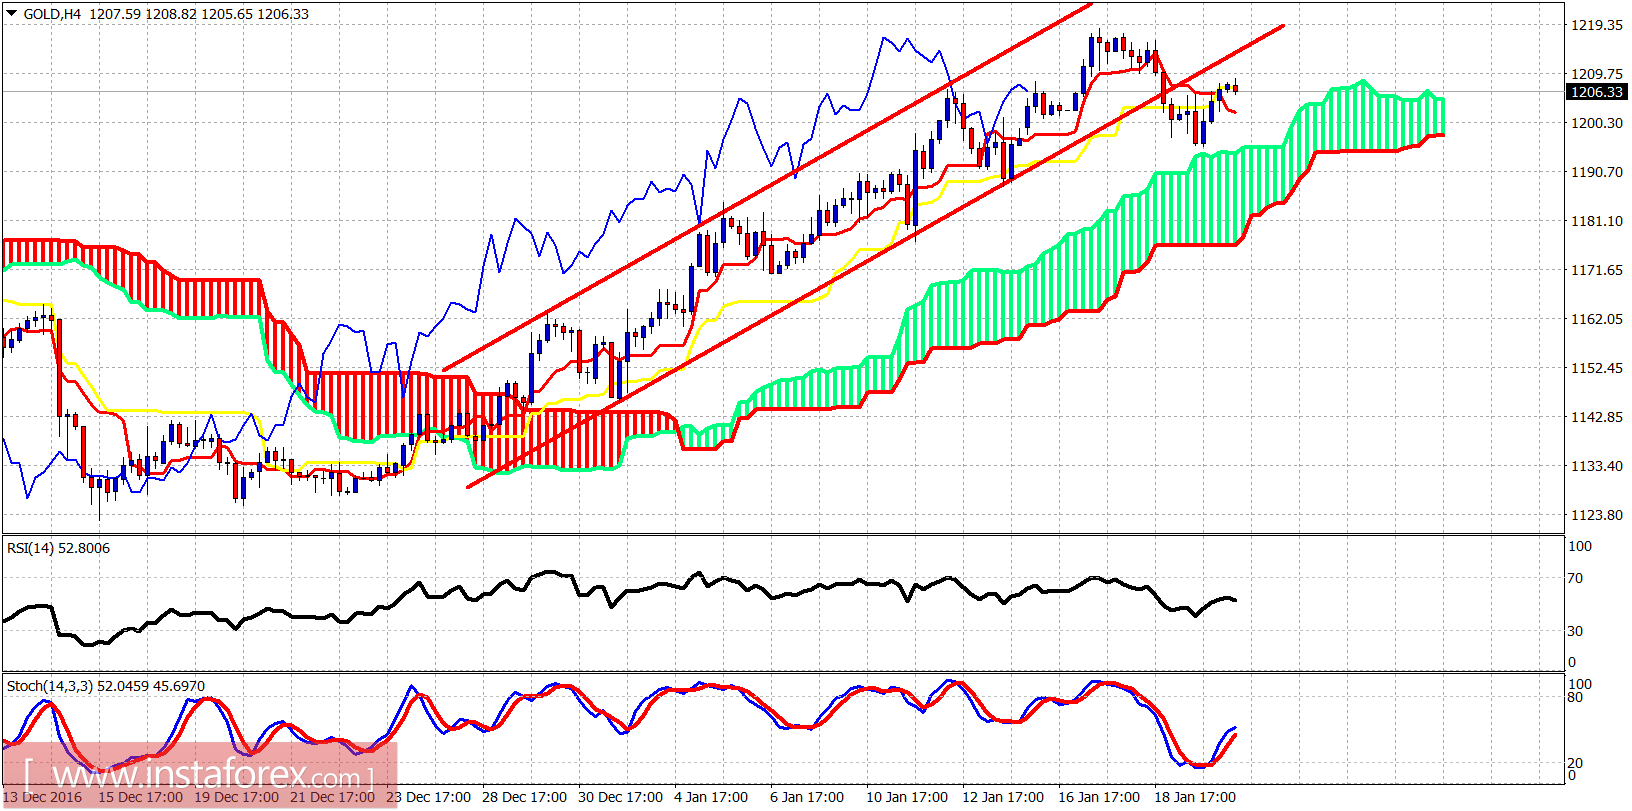
Gold price so far has made a shallow correction as low as $1,194 where prices reached the 4-hour Ichimoku cloud support and bounced back above $1,200. Gold price could see $1,210-15 today but bulls need to be very cautious as a break below $1,194 will open the way for a push towards $1,180-70.

Technical analysis of gold for January 20, 2017

Red lines - bullish channel

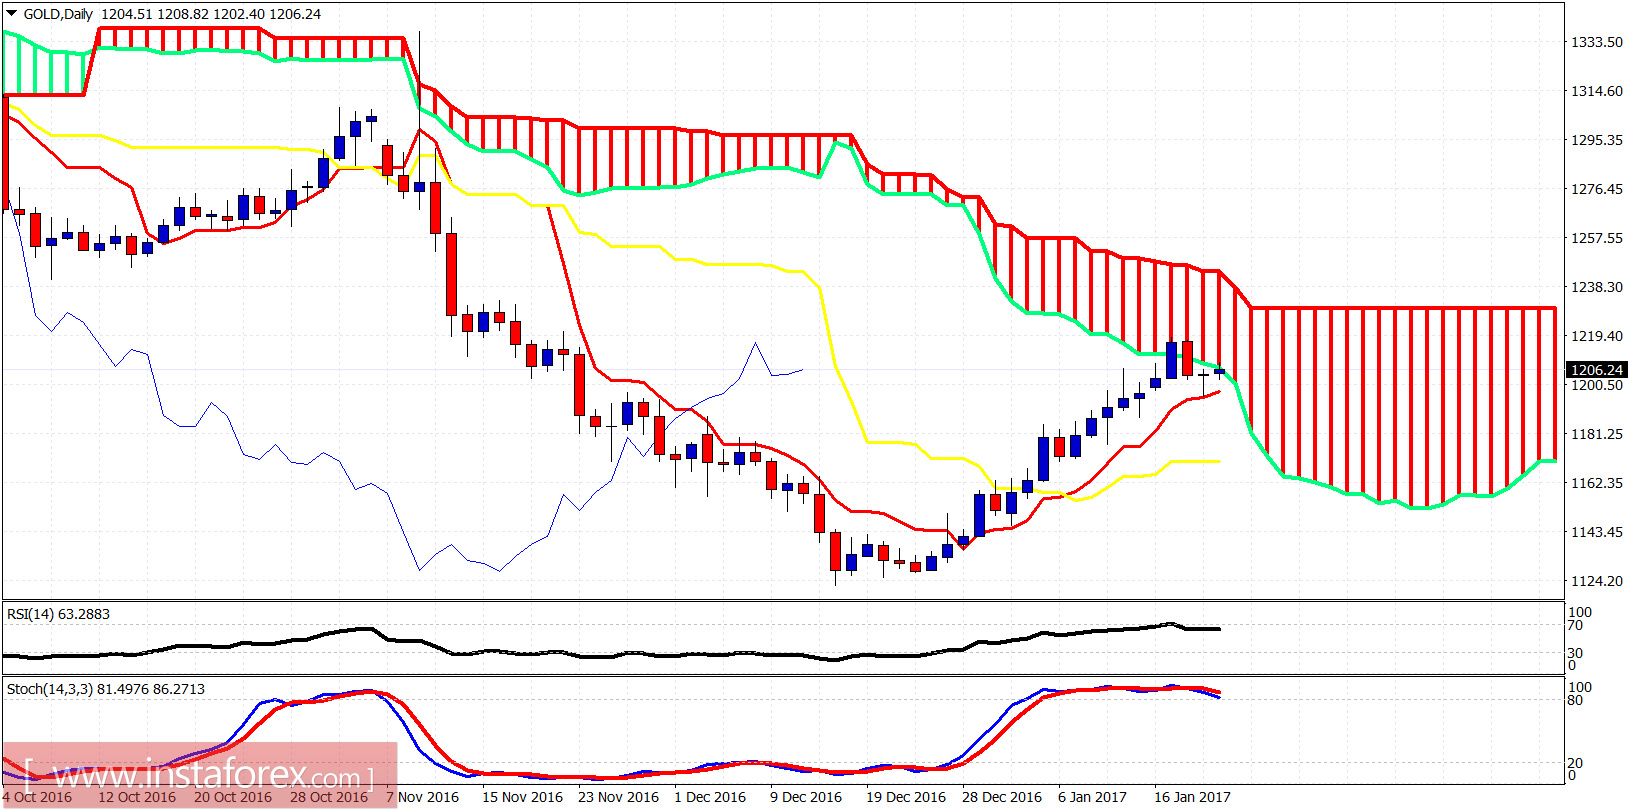
Gold price has broken out and below the bullish channel implying that Gold is in a corrective phase. This correction could push Gold price even towards $1,160 and still hold our bullish long-term scenario valid. Cloud support is at $1,194. If broken Gold price should move towards $1,180. Resistance is at $1,220.

Technical analysis of gold for January 20, 2017

Gold price is testing daily cloud resistance. Price is trying to break inside the daily cloud. Price pulled back yesterday but the daily tenkan-sen (red line indicator) supported price. The oscillators are near overbought area but there is no divergence on the daily chart. Daily kijun-sen (yellow line indicator) is found at our important support of $1,160. Pull backs are to be bought. I do not expect Gold to make new lows below $1,122.
Analyst InstaForex
Share this article:
parent
loader...
all-was_read__icon
You have watched all the best publications
presently.
We are already looking for something interesting for you...
all-was_read__star
Recently published:
loader...
More recent publications...