


Overview:
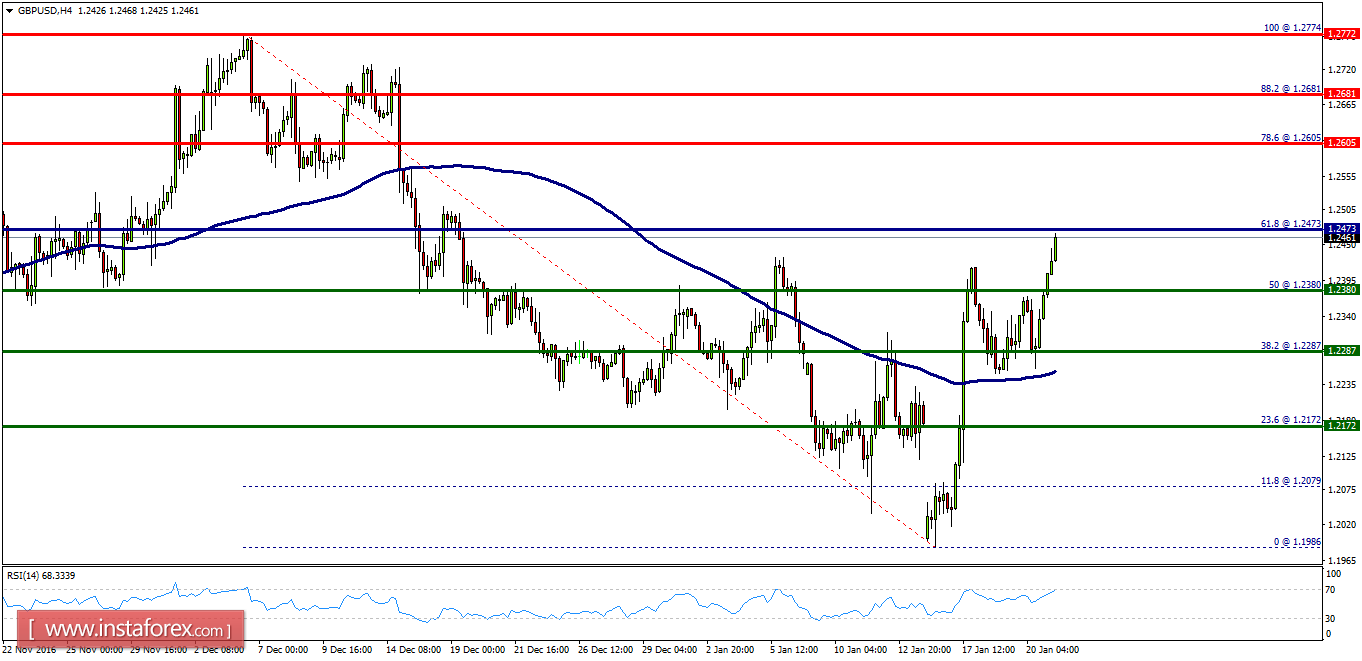
- On the four-hours chart, the GBP/USD pair continues moving in a bullish trend from the support levels of 1.2287 and 1.2380. Currently, the price is in a bullish channel. This is confirmed by the RSI indicator signaling that we are still in a bullish trending market. As the price is still above the moving average (100), immediate support is seen at 1.2380, while the weekly strong support is found at 1.2287. Consequently, the first support is set at the level of 1.2380. The market is likely to show signs of a bullish trend around the spot of 1.2380 - 1.2450. In other words, buy orders are recommended above the 1.2450 level with the first target at the level of 1.2605. Furthermore, if the trend is able to break through the first resistance level of 1.2605, we will see the pair climbing towards the double top (1.2774) to test it in coming days (this week). Thus, the market is indicating a bullish opportunity above the support levels of 1.2380 - 1.2450, for that the bullish outlook remains the same as long as the 100 EMA is headed to the upside. It would also be wise to consider where to place a stop loss; this should be set below the second support of 1.2287.


