


GBP/USD found resistance around 1.2645 and it's now testing the support zone of 1.2566. If the pair manages to break below that area, we could expect a corrective move toward the 200 SMA, but that shouldn't invalidate our bullish bias for the short-term. Bollinger band is showing a bearish path ongoing and that's why we would like to see more downside moves below the 1.2600 handle.
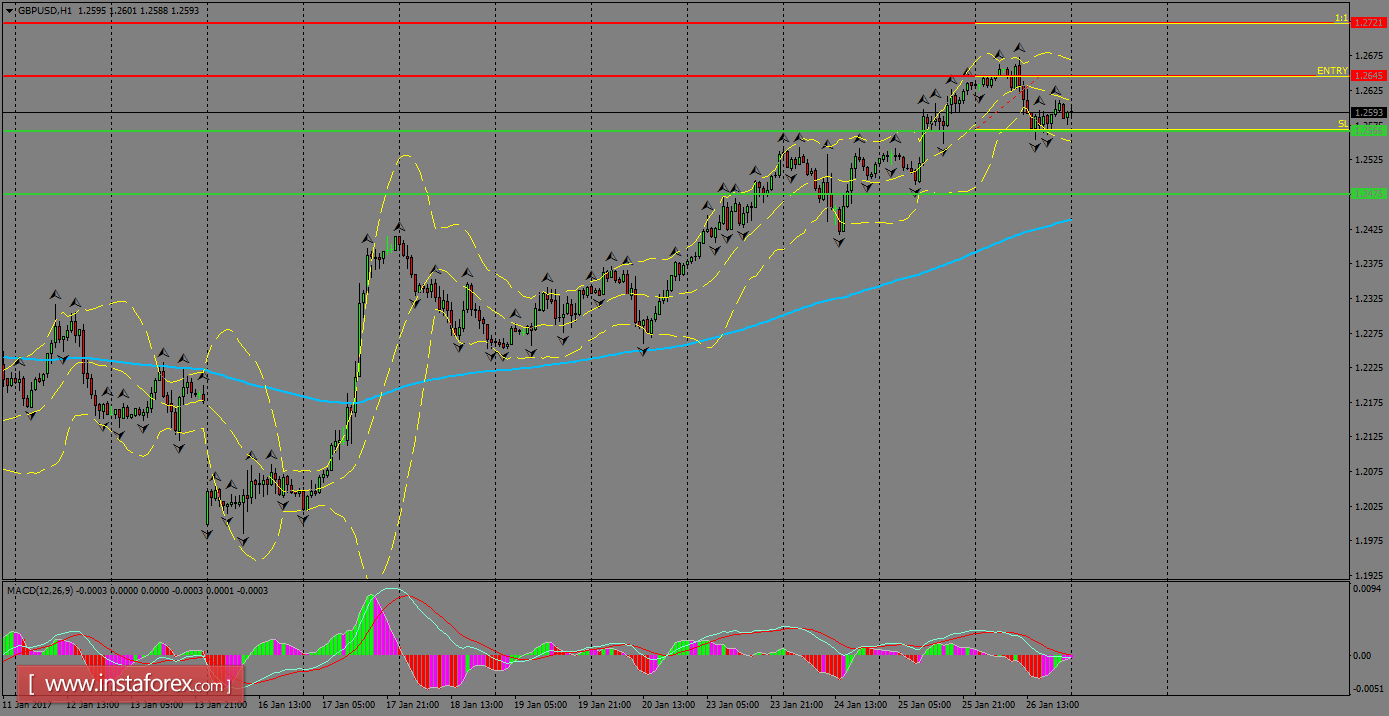
H1 chart's resistance levels: 1.2645 / 1.2721
H1 chart's support levels: 1.2566 / 1.2475
Trading recommendations for today: Based on the H1 chart, buy (long) orders only if the GBP/USD pair breaks a bullish candlestick; the resistance level is at 1.2645, take profit is at 1.2721 and stop loss is at 1.2566.


