


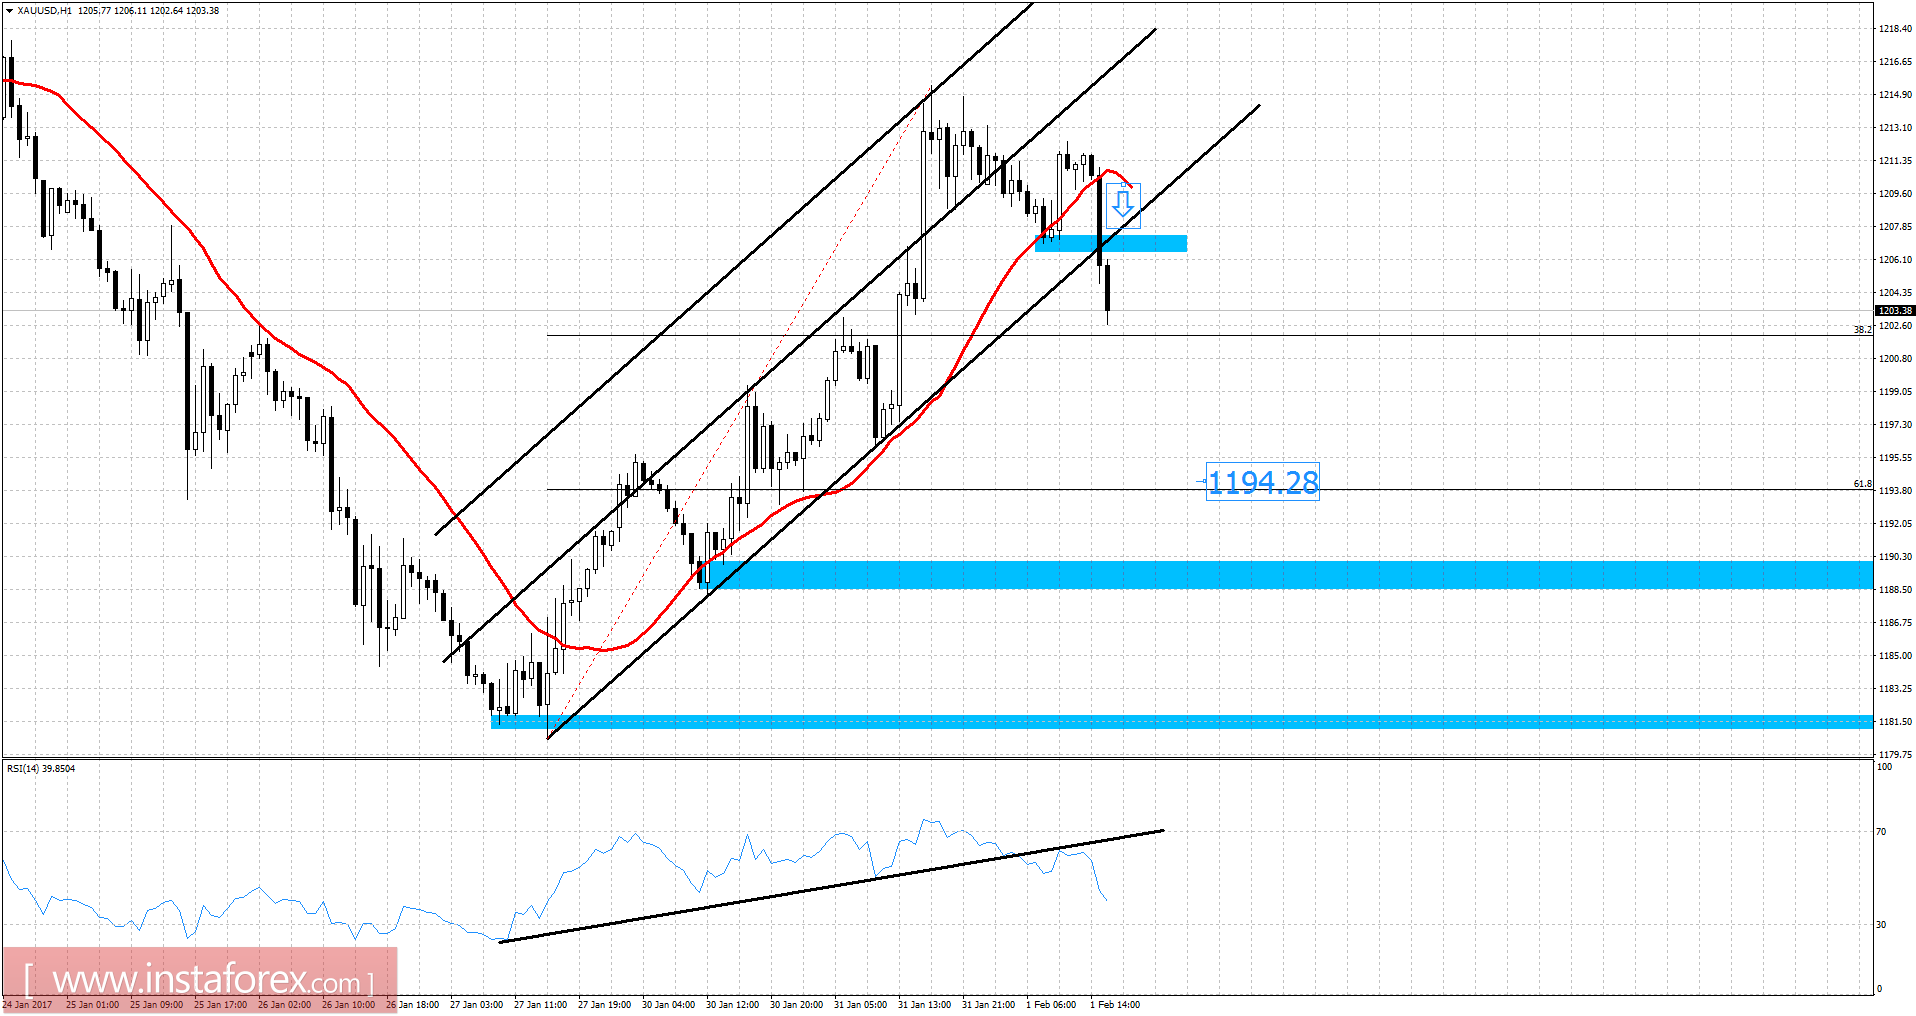
Recently, gold has been trading downwards. The price tested the level of $1,202.64. According to the 30M time frame, I found a broken upward channel, which is a sign for a potential downward price. My advice is to watch for potential selling opportunities. There is a broken support live on RSI, which is another sign of weakness. I placed Fibonacci to find potential downward target and I got Fibonacci retracement 61.8% at the price of $1,194.30.
Resistance levels:
R1: 1,213.70
R2: 1,218.00
R3: 1,226.80
Support levels:
S1: 1,197.50
S2: 1,192.90
S3: 1,184.55
Trading recommendations for today: Watch for potential selling opportunities.


