


GBP/USD is rallying across the board above the 200 SMA at H1 chart, following Fed's decision to keep rates on hold during January's meeting. Currently, the pair is poised to test the resistance zone of 1.2718, where a breakout higher should open the doors to test the 1.2840 level, while a pullback can produce a re-testing of the moving average mentioned above.
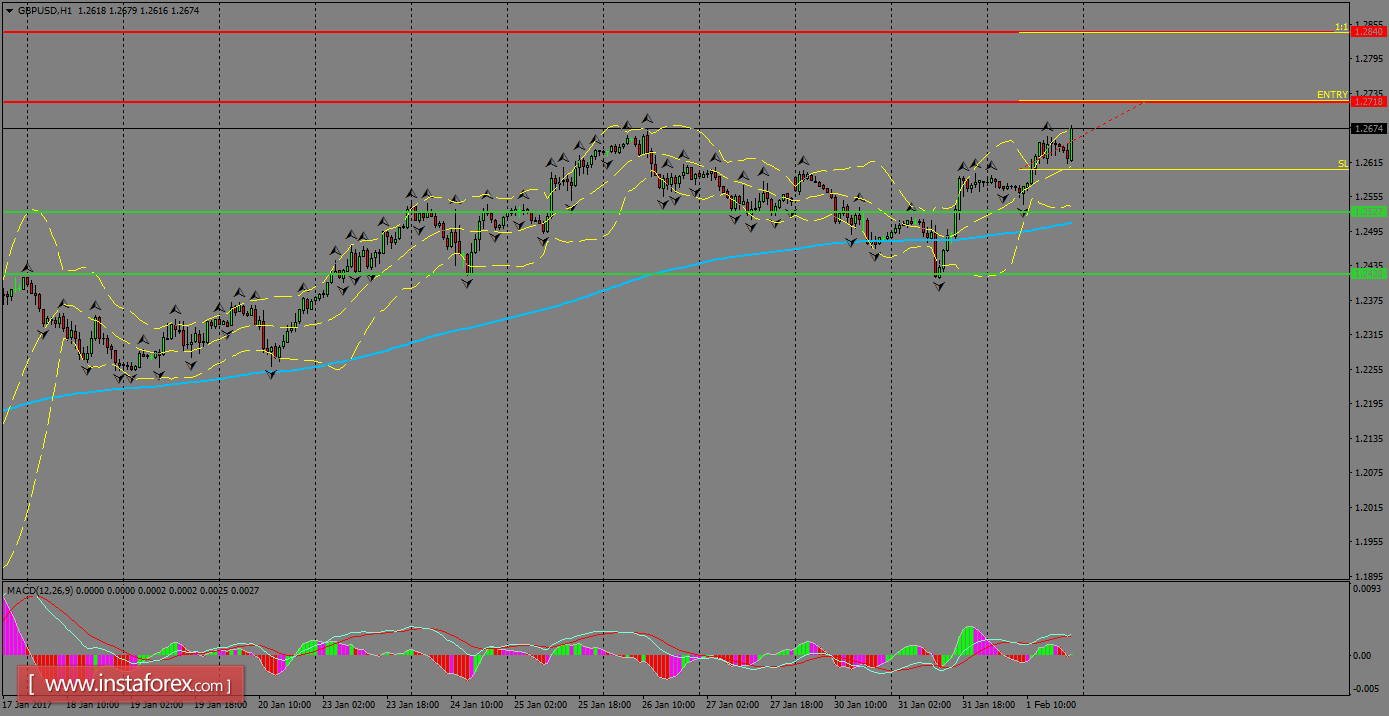
H1 chart's resistance levels: 1.2718 / 1.2840
H1 chart's support levels: 1.2527 / 1.2420
Trading recommendations for today: Based on the H1 chart, buy (long) orders only if the GBP/USD pair breaks a bullish candlestick; the resistance level is at 1.2718, take profit is at 1.2840 and stop loss is at 1.2601.


