


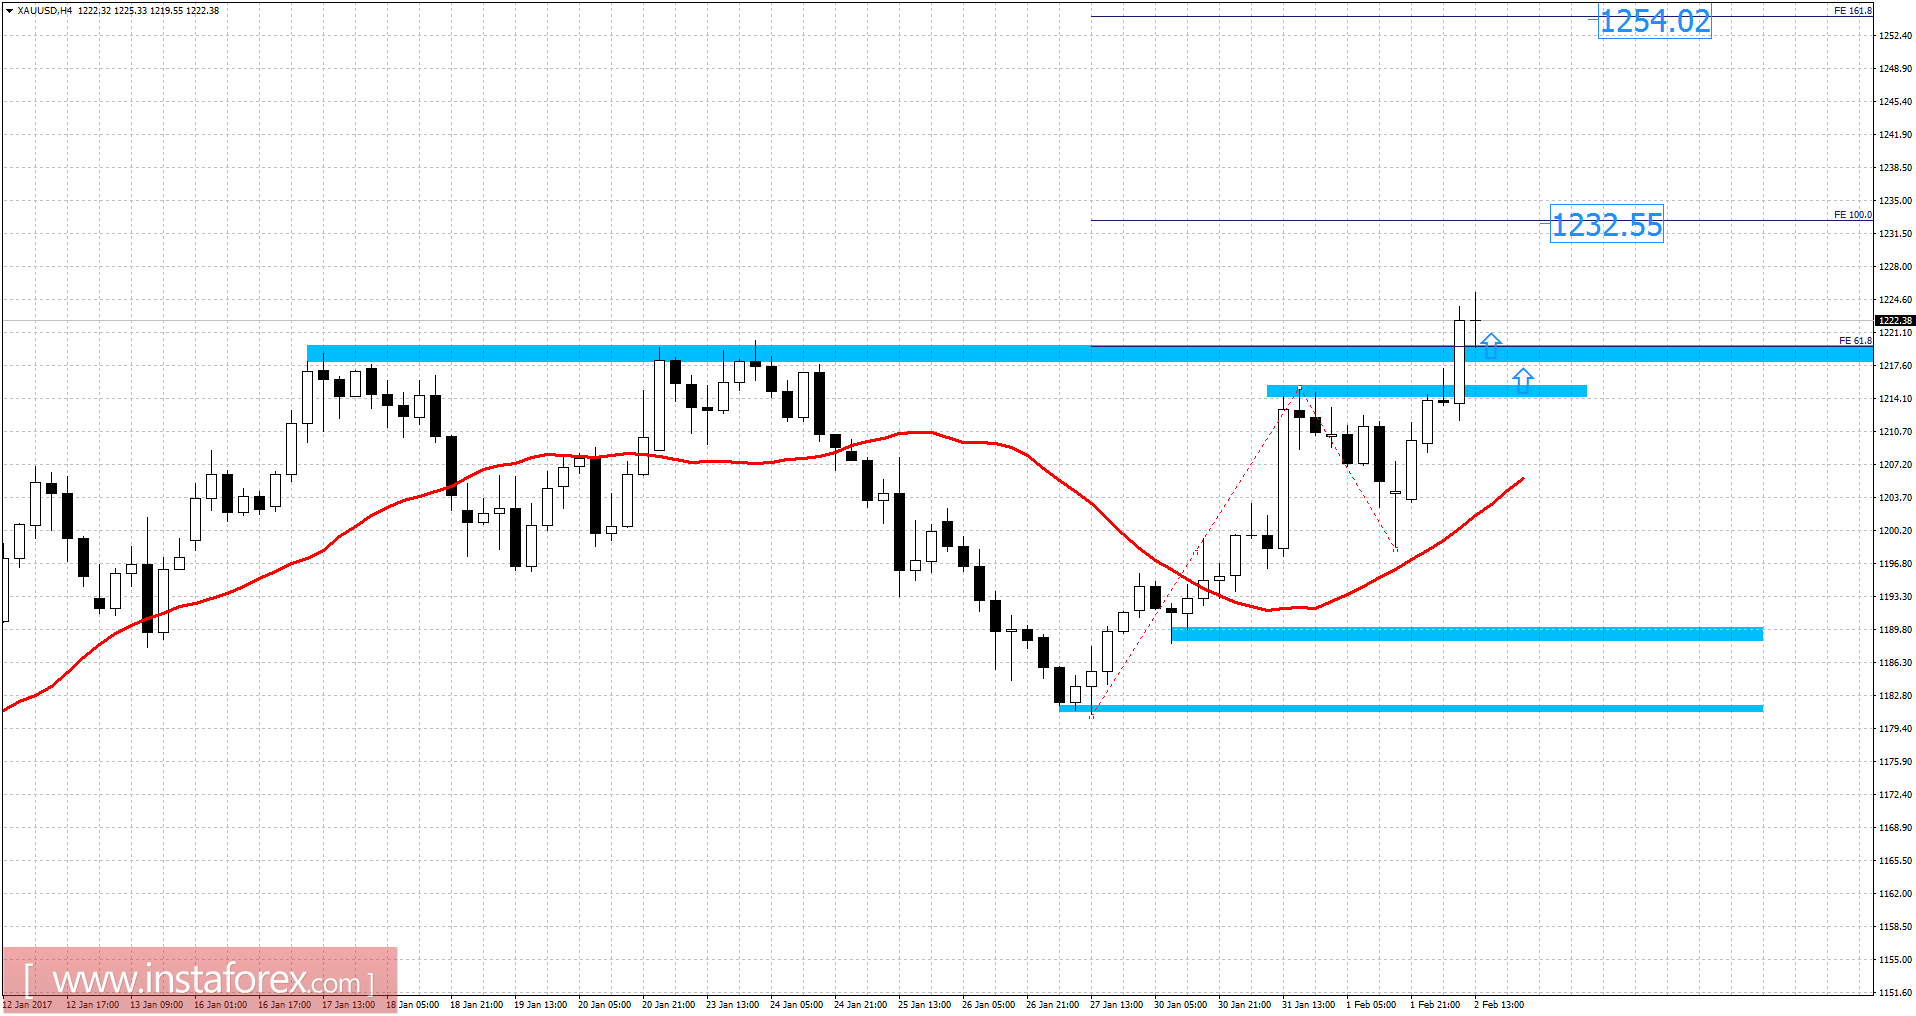
Recently, gold has been trading upwards. The price tested the level of $1,225.33. According to the 4H time frame, I found a broken resistance zone and broken Fibonacci expansion 61.8%, which is a sign of strength. I placed Fibonacci expansion to find potential upward targets. I got Fibonacci expansion 100% at the price of $1,232.55 and Fibonacci expansion 161.8% at the price of $1,254.00. Short-term trend is bullish. Watch for buying opportunities on the dips.
Fibonacci pivot points (5H)
Resistance levels:
R1: 1,227.40
R2: 1,229.60
R3: 1,233.20
Support levels:
S1: 1,200.15
S2: 1,217.90
S3: 1,214.30
Trading recommendations for today: watch for potential buying opportunities.


