


GBP/USD didn't have major changes in its structure after the US NFP's release, as the pair stayed above the support level of 1.2420. We're still seeing some sideways move around the 200 SMA at H1 chart and if the pair manages to break above 1.2591, then we can expect further gains toward the 1.2718 level and that's a likely scenario, due to the fact that the 1.2420 zone is still intact.
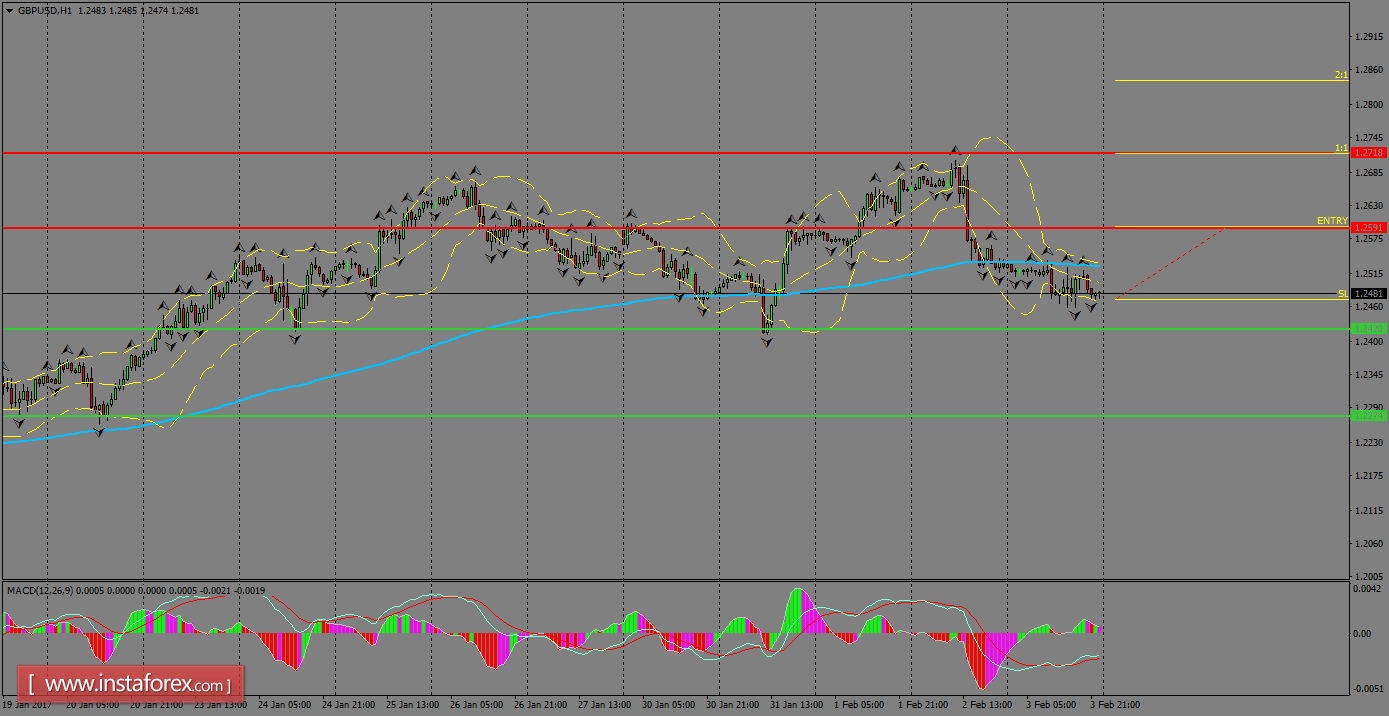
H1 chart's resistance levels: 1.2591 / 1.2718
H1 chart's support levels: 1.2420 / 1.2274
Trading recommendations for today: Based on the H1 chart, buy (long) orders only if the GBP/USD pair breaks a bullish candlestick; the resistance level is at 1.2591, take profit is at 1.2718 and stop loss is at 1.2471.


