


The Dollar index is testing important short-term resistance as we mentioned yesterday. The price is showing signs of rejection. The 100.80 level is a key resistance, while a break below 100 will be the confirmation I need for my bearish short-term view for a new low around 99.
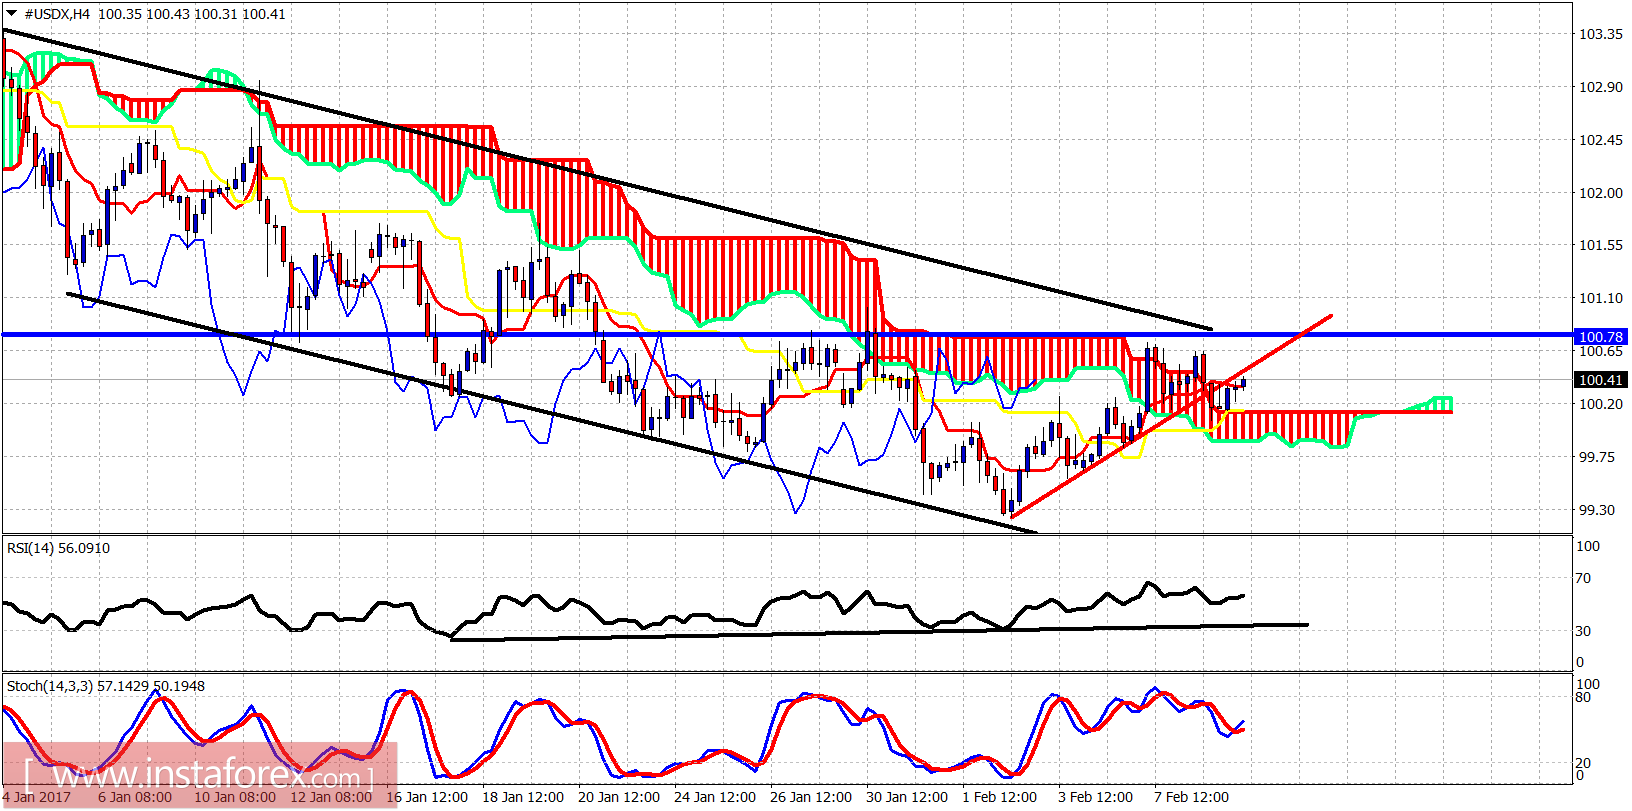
Blue line - horizontal resistance
Red line - short-term trendline support
The Dollar index is trading above the Ichimoku cloud. The price has broken the short-term trendline support and now comes back to test it. The short-term support is at 100 and resistance is at 100.80. I continue to expect the price to make a new low towards 99 or lower.
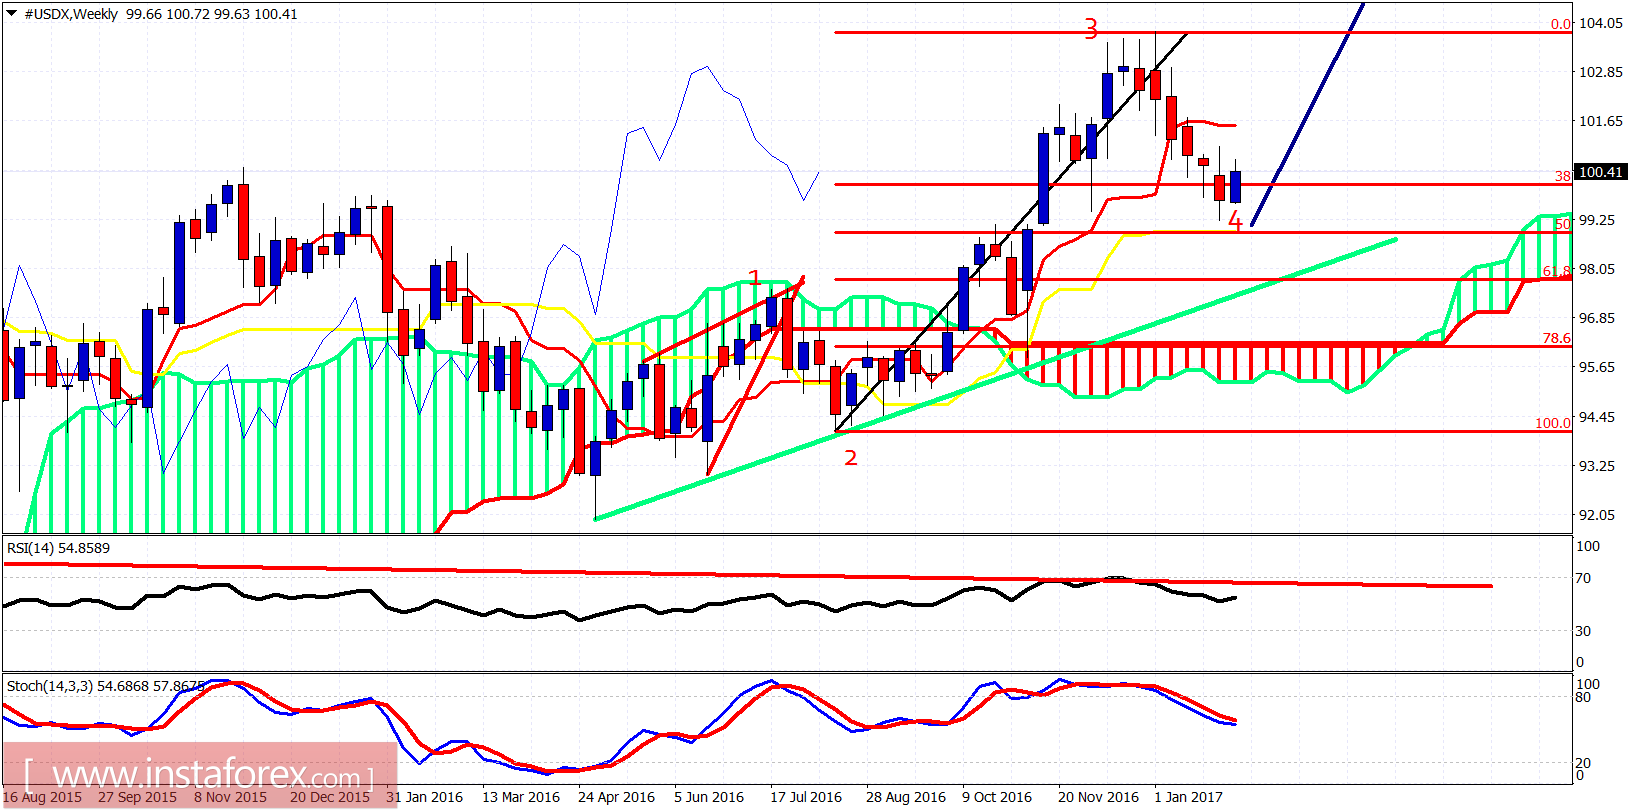
Blue line - projection forward
My preferred scenario so far has been that we are making wave 4 down and we should soon see a reversal as a part of wave 5. The short-term trend remains bearish and if the price overlaps the wave 1 high, this scenario will be canceled and a more bearish view will be adopted. Either way a bounce is justified for USD from current or lower levels. Critical support for the longer-term bullish view remains the green upward sloping trendline.


