


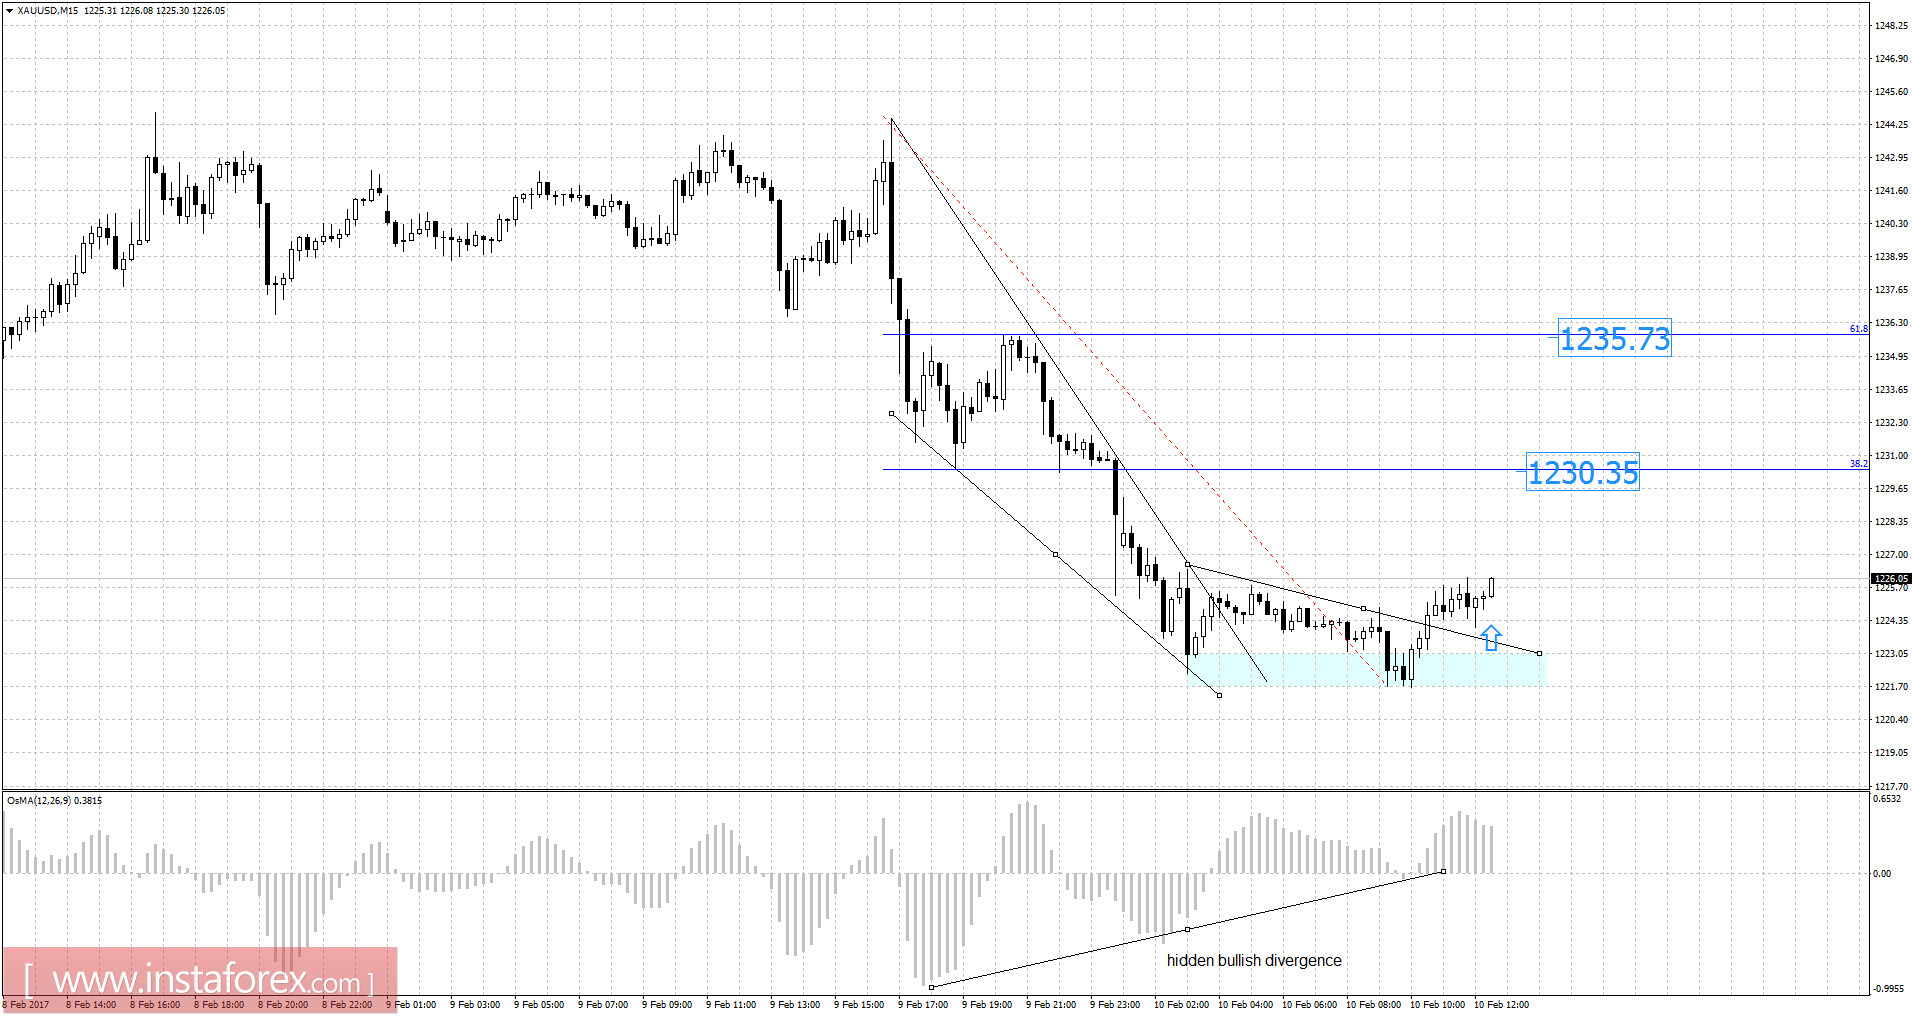
Recently, gold has been trading downwards. The price tested the level of $1,221.70. According to the 15M time frame, I found bullish hidden divergence in the progress. My advice is to watch for potential buying opportunities. There is a broken supply trendline in the background. I have placed Fibonacci retracement to find potential upward targets. I got Fibonacci retracement 38.2% at the price of $1,230.35 and Fibonacci retracement 61.8% at the price of $1,235.70.
Fibonacci pivot points:
Resistance levels:
R1: 1,241.50
R2: 1,245.50
R3: 1,251.70
Support levels:
S1: 1,228.50
S2: 1,224.90
S3: 1,218.60
Trading recommendations for today: watch for potential buying opportunities.


