


The pair is struggling to consolidate above the 200 SMA at H1 chart and it's possible that we could see another decline toward 1.2414. It seems that the bears are gathering momentum to extend the leg to lower levels, but to validate such scenario, we should see a breakout below the 1.2414 level. MACD indicator is supporting the bearish bias in the short-term.
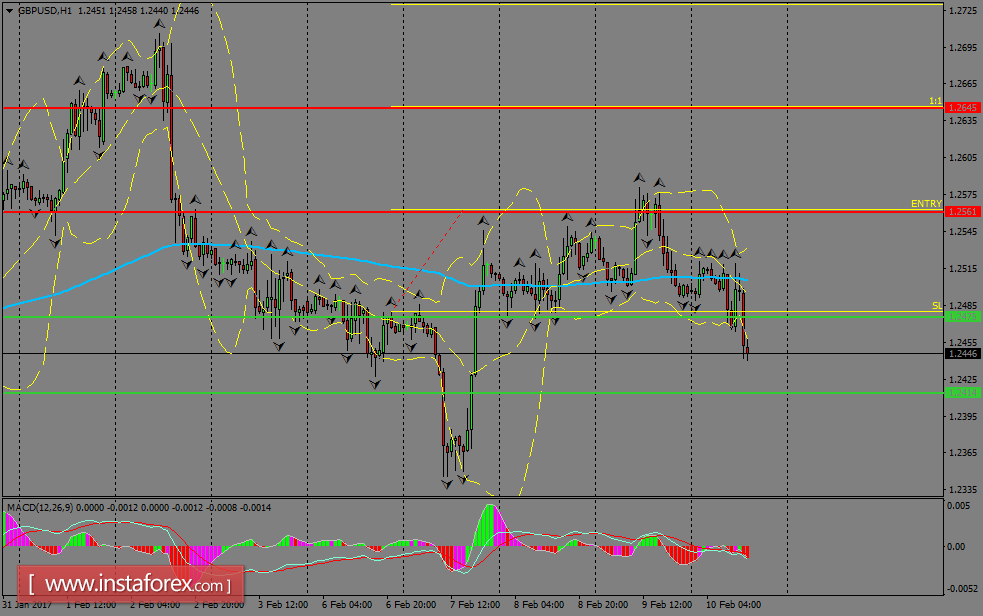
H1 chart's resistance levels: 1.2561 / 1.2645
H1 chart's support levels: 1.2475 / 1.2414
Trading recommendations for today: Based on the H1 chart, buy (long) orders only if the GBP/USD pair breaks a bullish candlestick; the resistance level is at 1.2561, take profit is at 1.2645 and stop loss is at 1.2480.


