


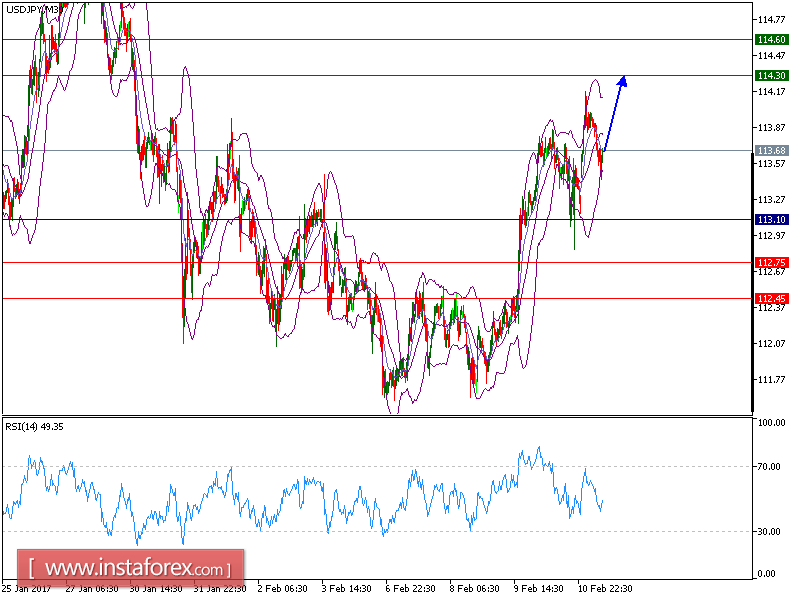
USD/JPY is expected to trade with bullish bias. The pair broke above its 20-period and 50-period moving averages with a bullish gap. The relative strength index is bullish above its neutrality level at 50 and is heading upwards. Additionally, the pair also broke above the upper boundary of the Bollinger Bands, which could signal a continuation of positive trend.
As long as 113.10 is support, look for a further upside with up targets at 114.30 and 114.60 in extension.
Recommendation:
The pair is trading above its pivot point. It is likely to trade in a wider range as long as it remains above its pivot point. Therefore, long positions are recommended with the first target at 114.30 and the second one at 114.60. In the alternative scenario, short positions are recommended with the first target at 112.75 if the price moves below its pivot points. A break of this target is likely to push the pair further downwards, and one may expect the second target at 112.45. The pivot point is at 113.10.
Resistance levels: 112.75, 112.45, and 112.00. Support levels: 114.30, 114.60, and 114.95.


