


The Dollar index has broken out of the bearish channel. Short-term trend remains bullish as price is making higher highs and higher lows. The Dollar index could also be forming a head and shoulders pattern and that is why it is very important to keep a close eye on any possible pull back.
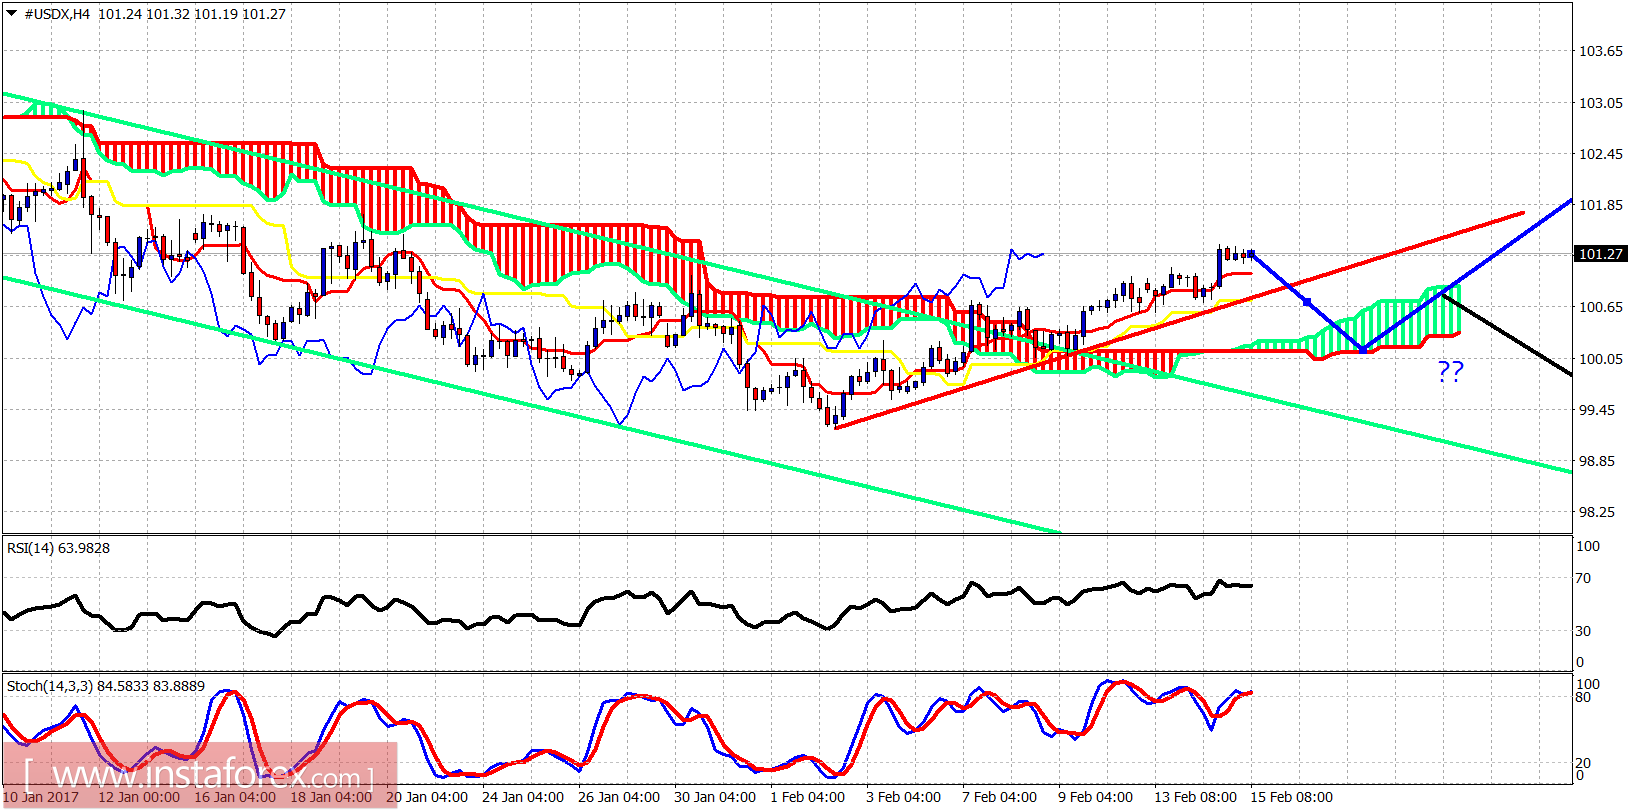
Blue line - bullish scenario
Green lines - bearish channel
Black line - bearish scenario
The Dollar index is trading above the red trend line support and above the 4 hour Ichimoku cloud. Trend is bullish. The Dollar index could very well have completed an important low at 99.20 and may have started its next leg up toward 105-110. A pull back toward 100 is justified. Traders need to pay close attention to the coming short-term pull back as we have a Head and Shoulders bearish pattern being formed, with a neckline at 99-99.20. The right shoulder is still not fully formed but we have to be cautious in case this pattern plays out.
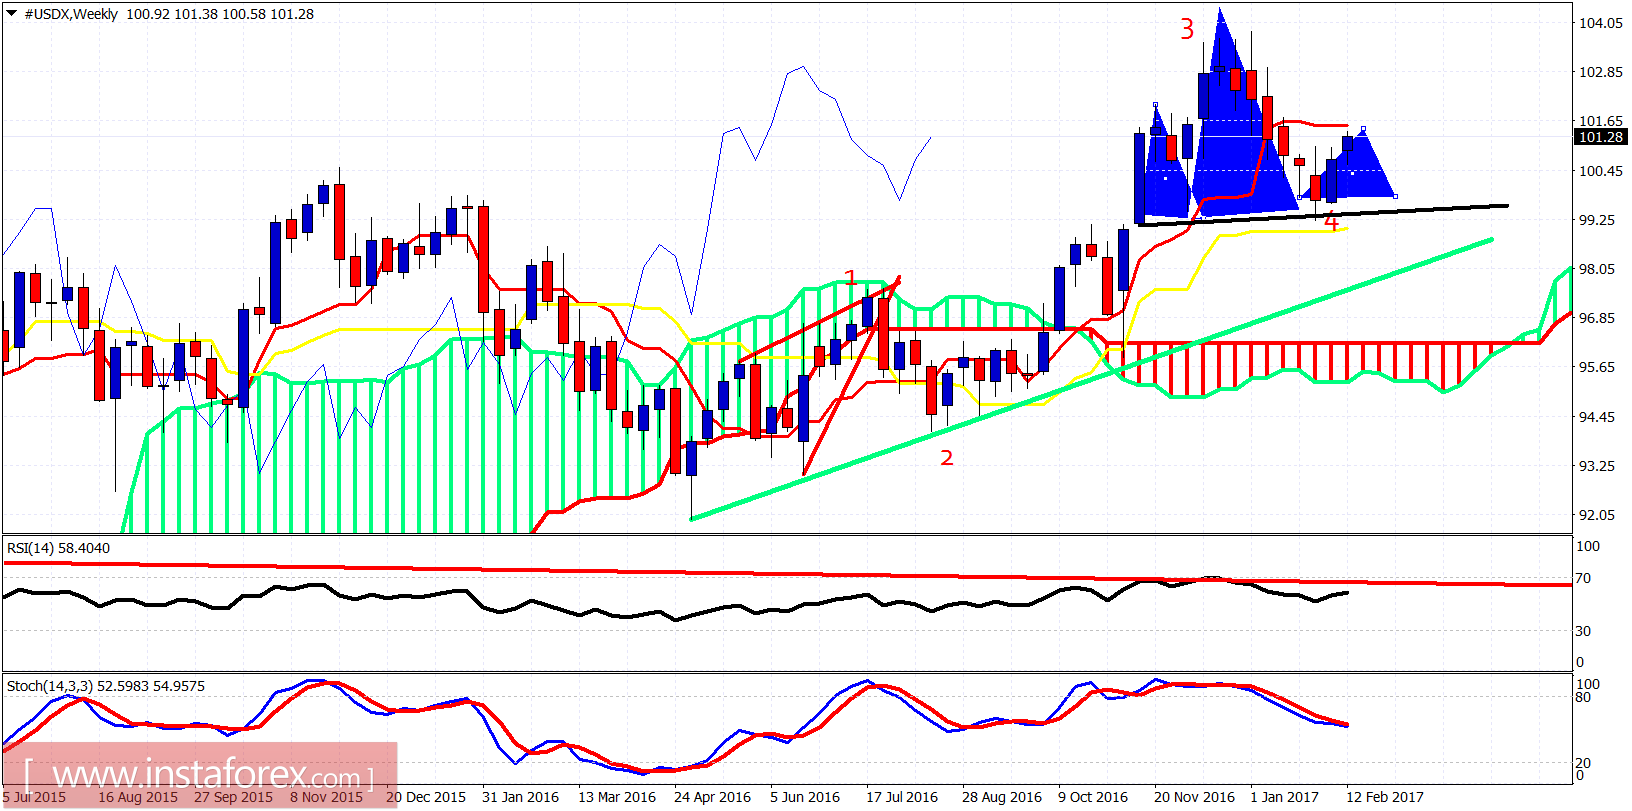
Black line - neckline
Blue triangles - head and shoulder pattern
The Dollar index is testing the tenkan-sen (red line indicator) in the weekly chart. A rejection here will push the index back toward the kijun-sen (yellow line indicator) or at least toward the 61.8% Fibonacci retracement of the recent rise from 99.20. Holding above 99 will be decisive for the longer-term bullish trend and our bullish scenario.


