


The Dollar index is pulling back as we expected in our latest analysis. Although the price has broken out of the bearish channel and we might have completed a wave 4 low at 99.24, the bearish Head and Shoulders pattern should not be overlooked. A break below the neck line will be a very bearish sign. Otherwise a higher low will be a bullish sign.
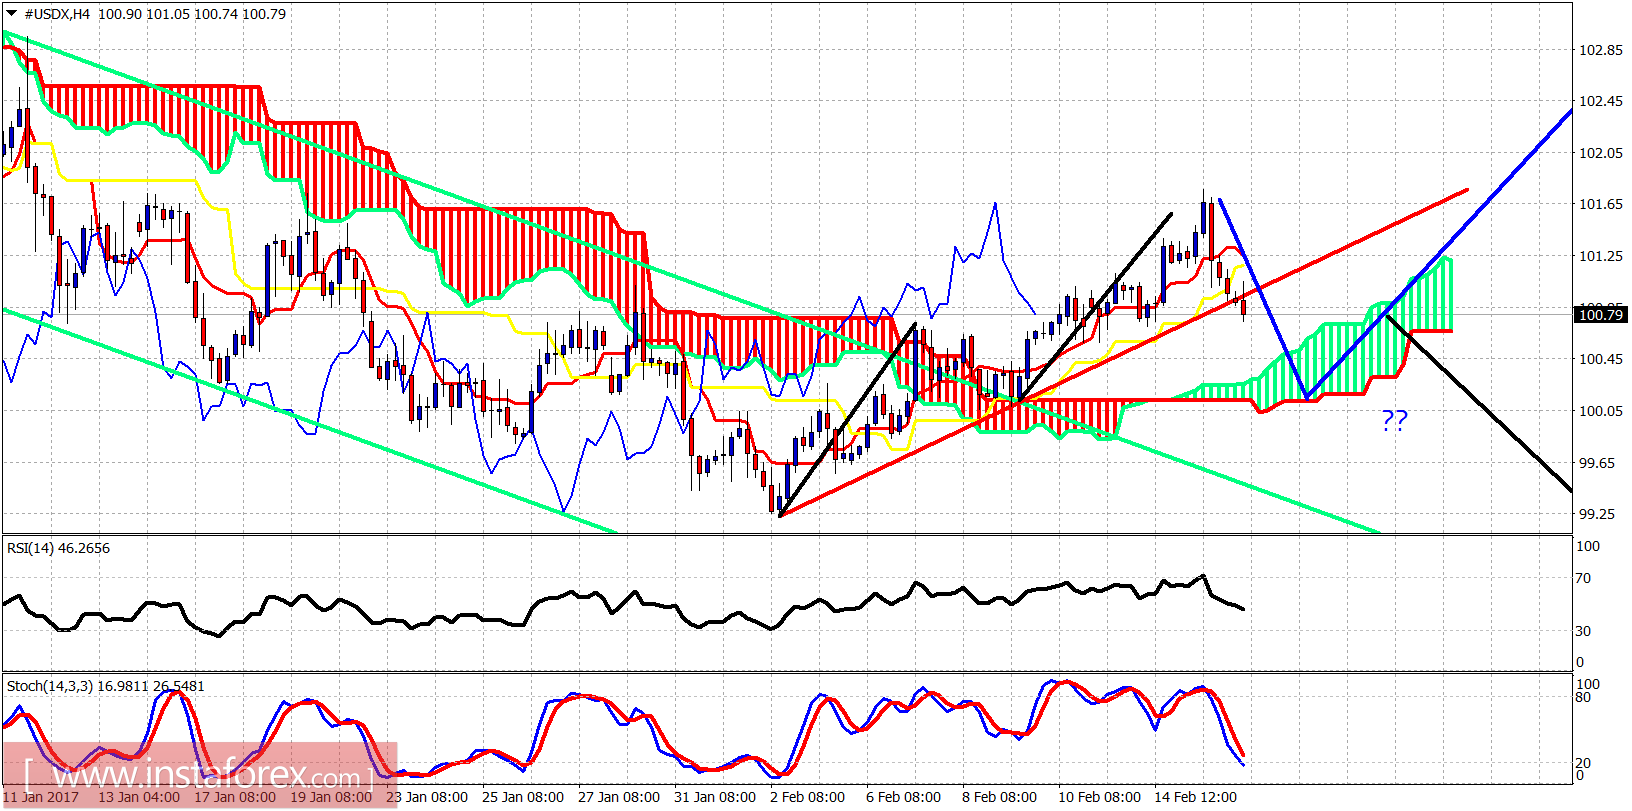
Blue lines - projected price path ahead bullish scenario
Black line - bearish scenario
The Dollar index is pulling back towards cloud support. I expect to see a big test of short-term support around the 100 level. If the bulls manage to hold this level and bounce, a higher low will be a very bullish signal for the Dollar index. If, however, sellers prevail and break below this year's low at 99.24, we should expect heavy selling to follow.
Green trend line - long-term support
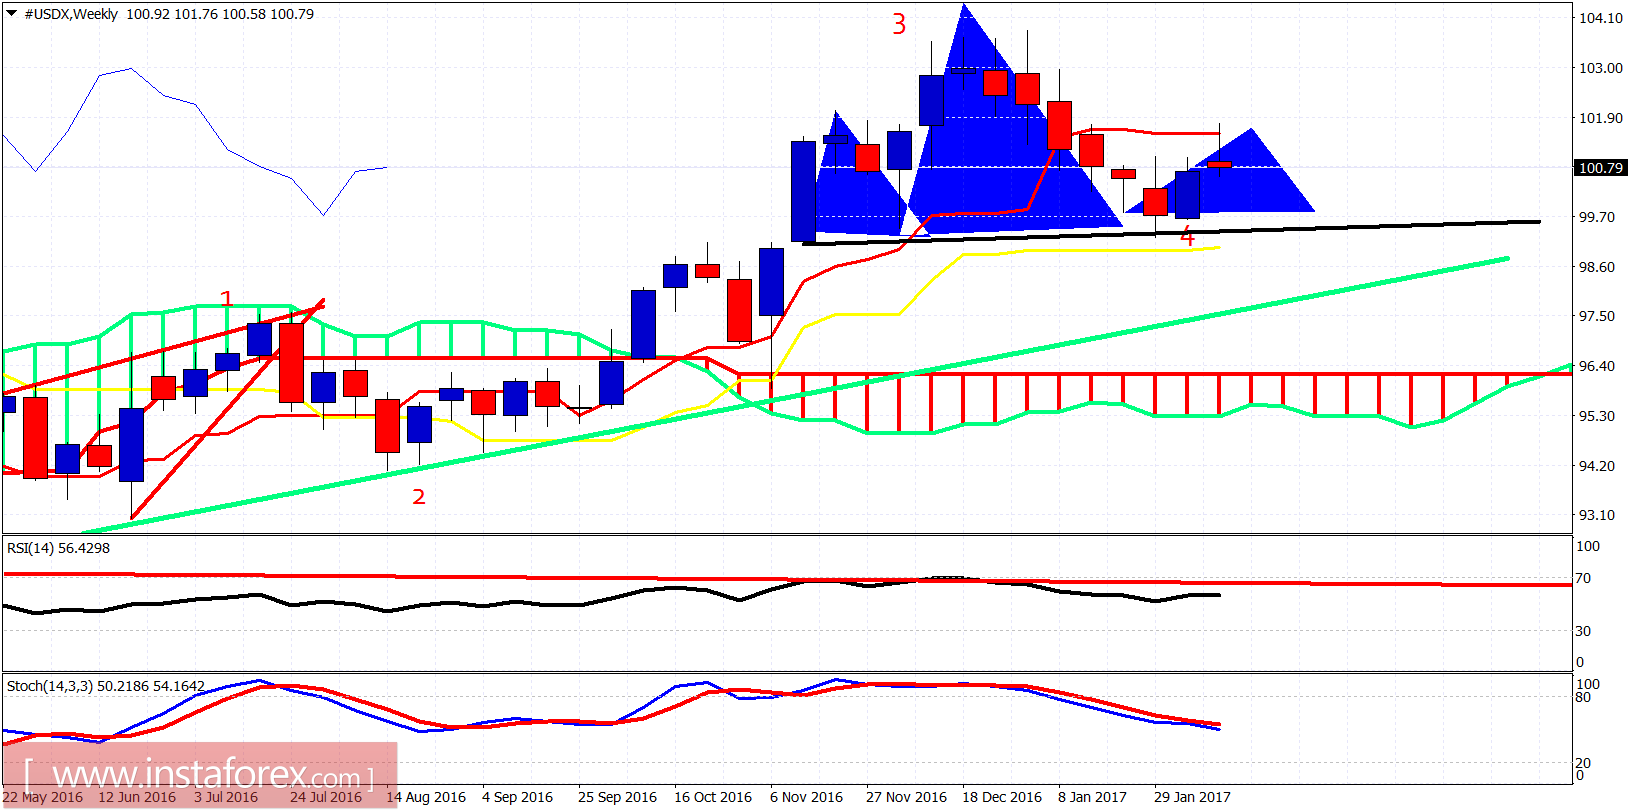
Black line - Head and Shoulders neckline
The Dollar index got rejected at the weekly tenkan-sen (red line indicator). This was expected. The pullback is now very important to hold above the black neckline for the bulls. This support area of 99.20-99 is very important as we also find the weekly kijun-sen (yellow line indicator) there.


