


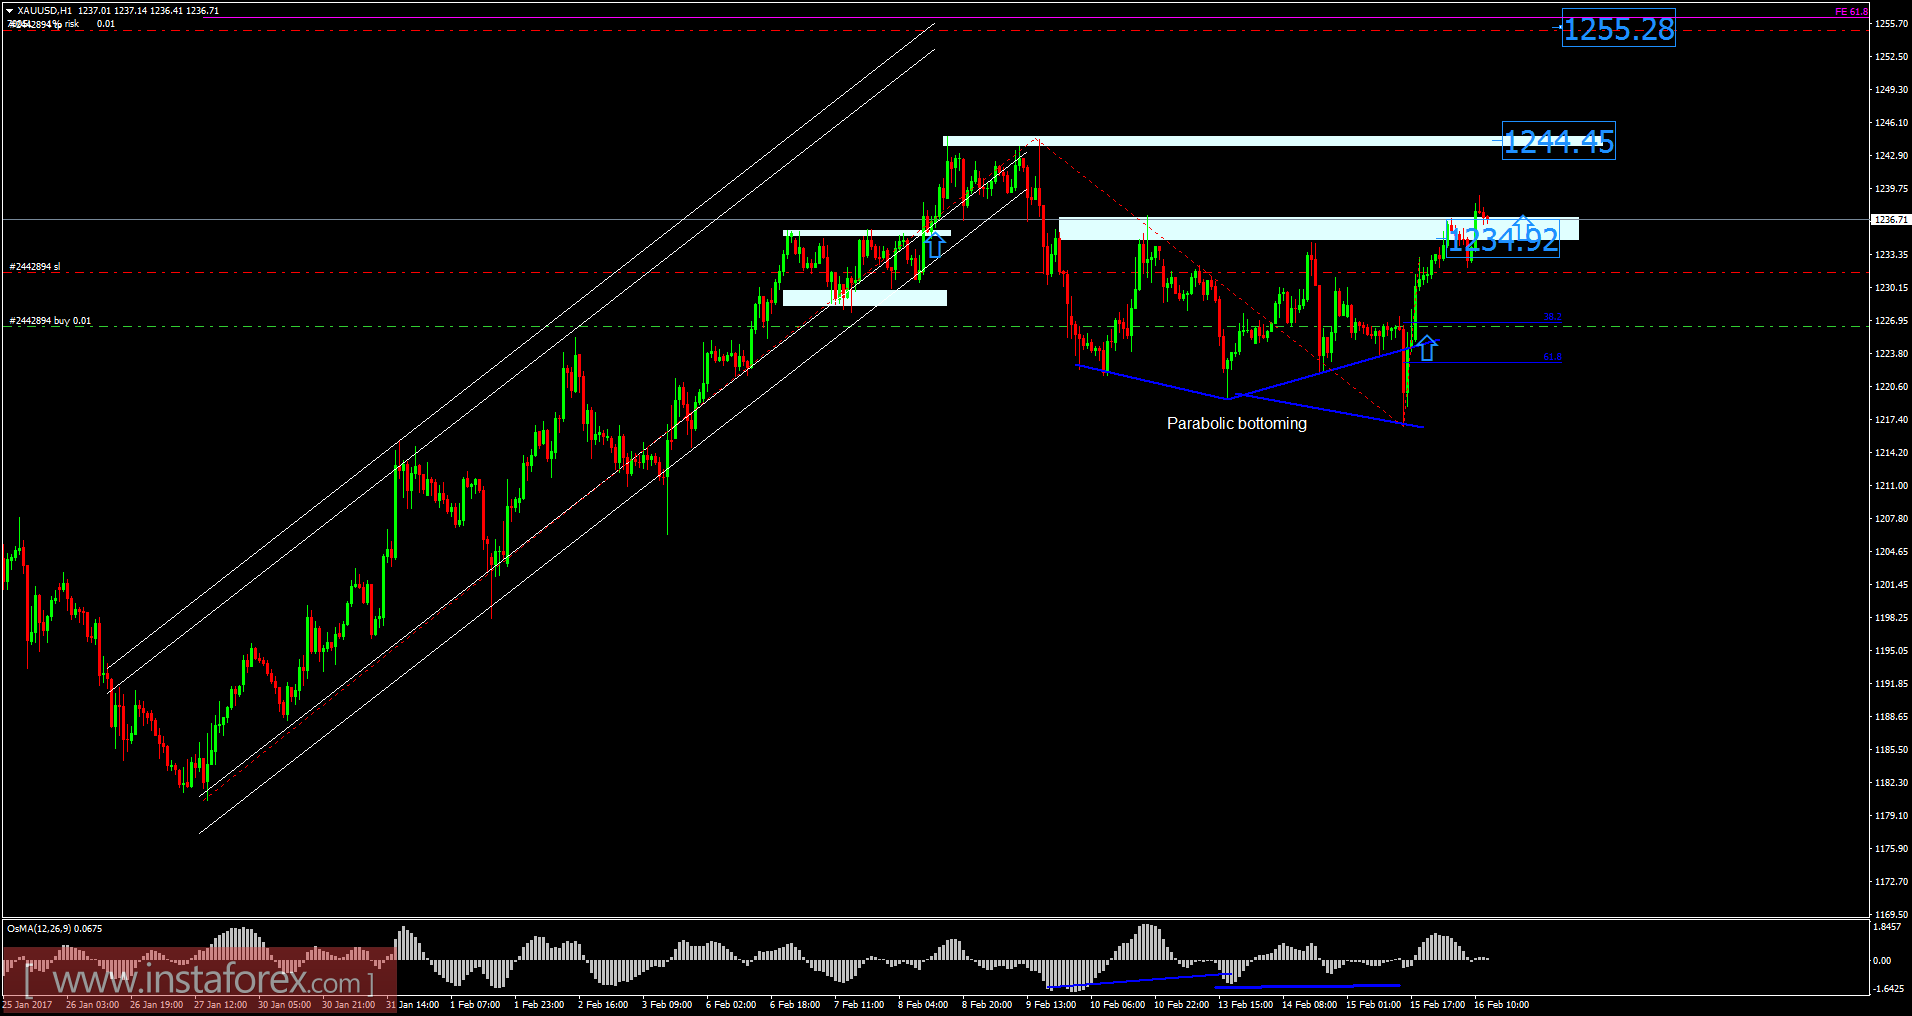
Recently, gold has been trading upwards. As I expected, the price tested the level of $1,235.00. According to the 1H time frame, I found hidden bullish divergence and parabolic bottoming, which is a sign that selling looks risky. My advice is to watch for potential buying opportunities. Targets are set at the price of $1,244.00 and $1,255.30 (Fibonacci expansion 61.8%).
Fibonacci pivot points:
Resistance levels:
R1: 1,239.00
R2: 1,239.30
R3: 1,240.00
Support levels:
S1: 1,237.70
S2: 1,237.20
S3: 1,236.60
Trading recommendations for today: watch for potential buying opportunities.


