


The index performed a rebound around the 100.44 level following another sellers' wave, but it seems that we could expect further bullish moves above the 200 SMA in th H1 chart, targeting the key resistance zone of 101.43. If the USDX makes a breakout over there, the doors will be opened for another rally towards 102.39. Meanwhile, on the downside, we can project the 99.84 level as the next key interest area.
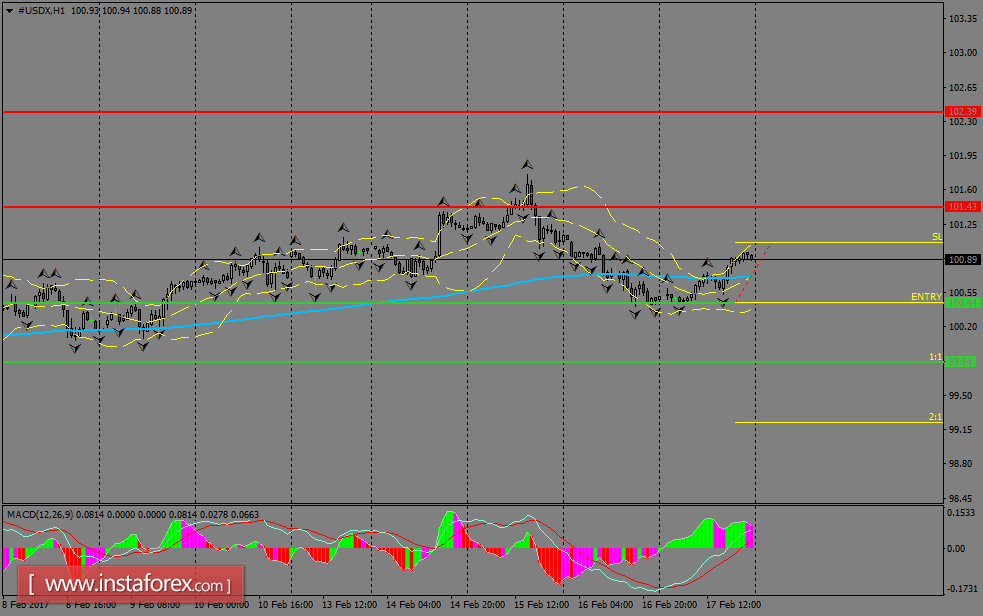
H1 chart's resistance levels: 101.43 / 102.38
H1 chart's support levels: 100.44 / 99.84
Trading recommendations for today: Based on the H1 chart, place sell (short) orders only if the USD Index breaks with a bearish candlestick; the support level is at 100.44, take profit is at 99.84 and stop loss is at 101.06.


