Main Quotes Calendar Forum
flag

FX.co ★ Technical analysis of gold for February 20, 2017

parent
Forex Analysis:::2017-02-20T08:13:23

Technical analysis of gold for February 20, 2017

Gold remains in bullish trend. There is no indication that a deeper pull back is coming. Short-term support is held and the precious metal is ready for a push higher toward $1,280-$1,320.
Technical analysis of gold for February 20, 2017

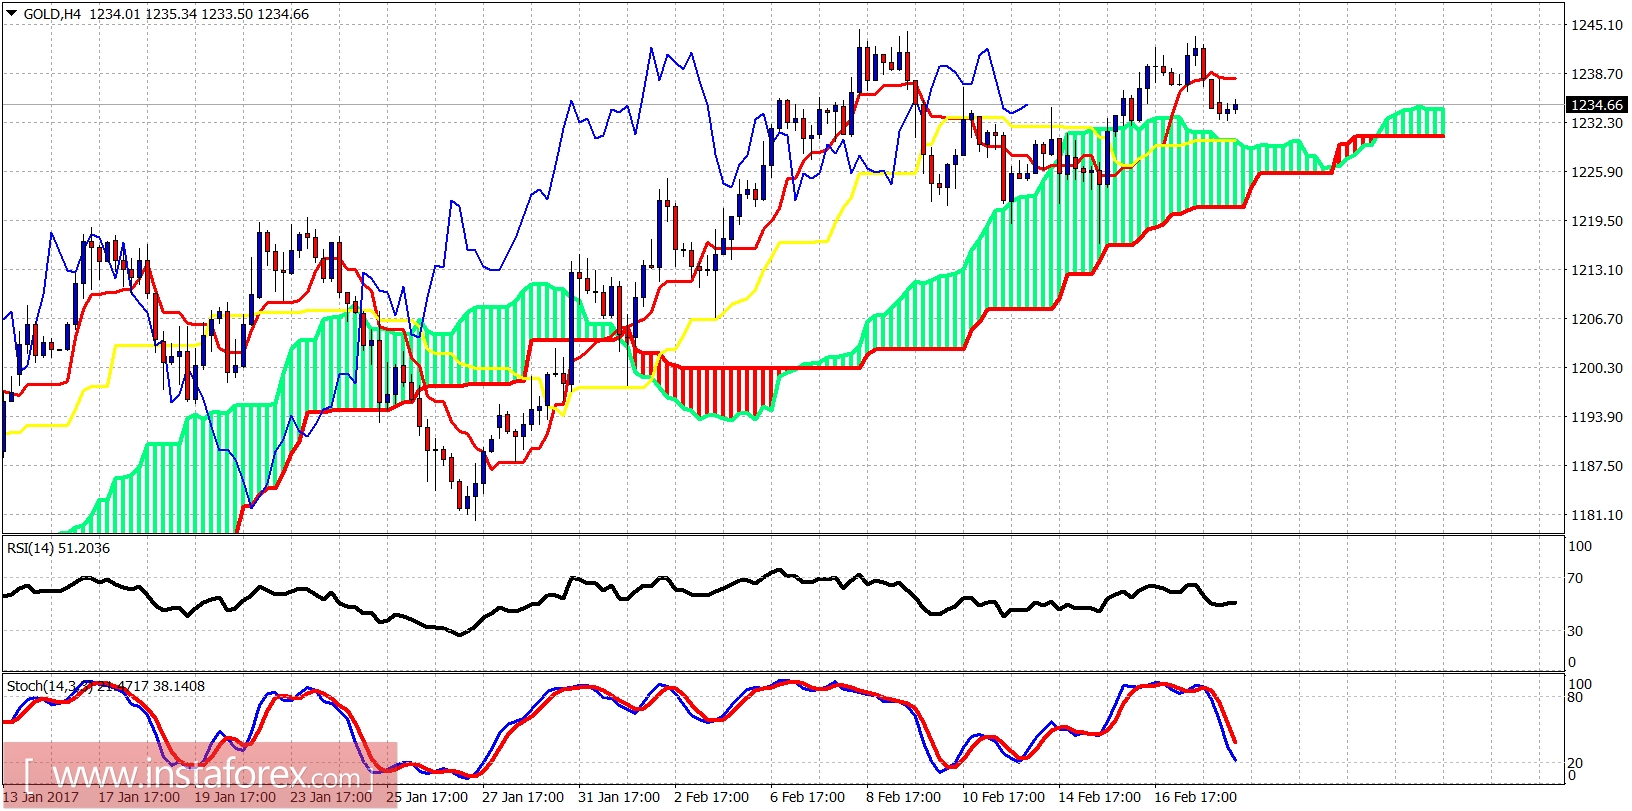
Gold price is trading above the Ichimoku cloud in the 4 hour chart. Short-term support is at $1,230. Next support is at $1,216 and next at $1,200. Resistance is at $1,244-45. If broken we have confirmation for a move toward $1,280-$1,320.

Technical analysis of gold for February 20, 2017

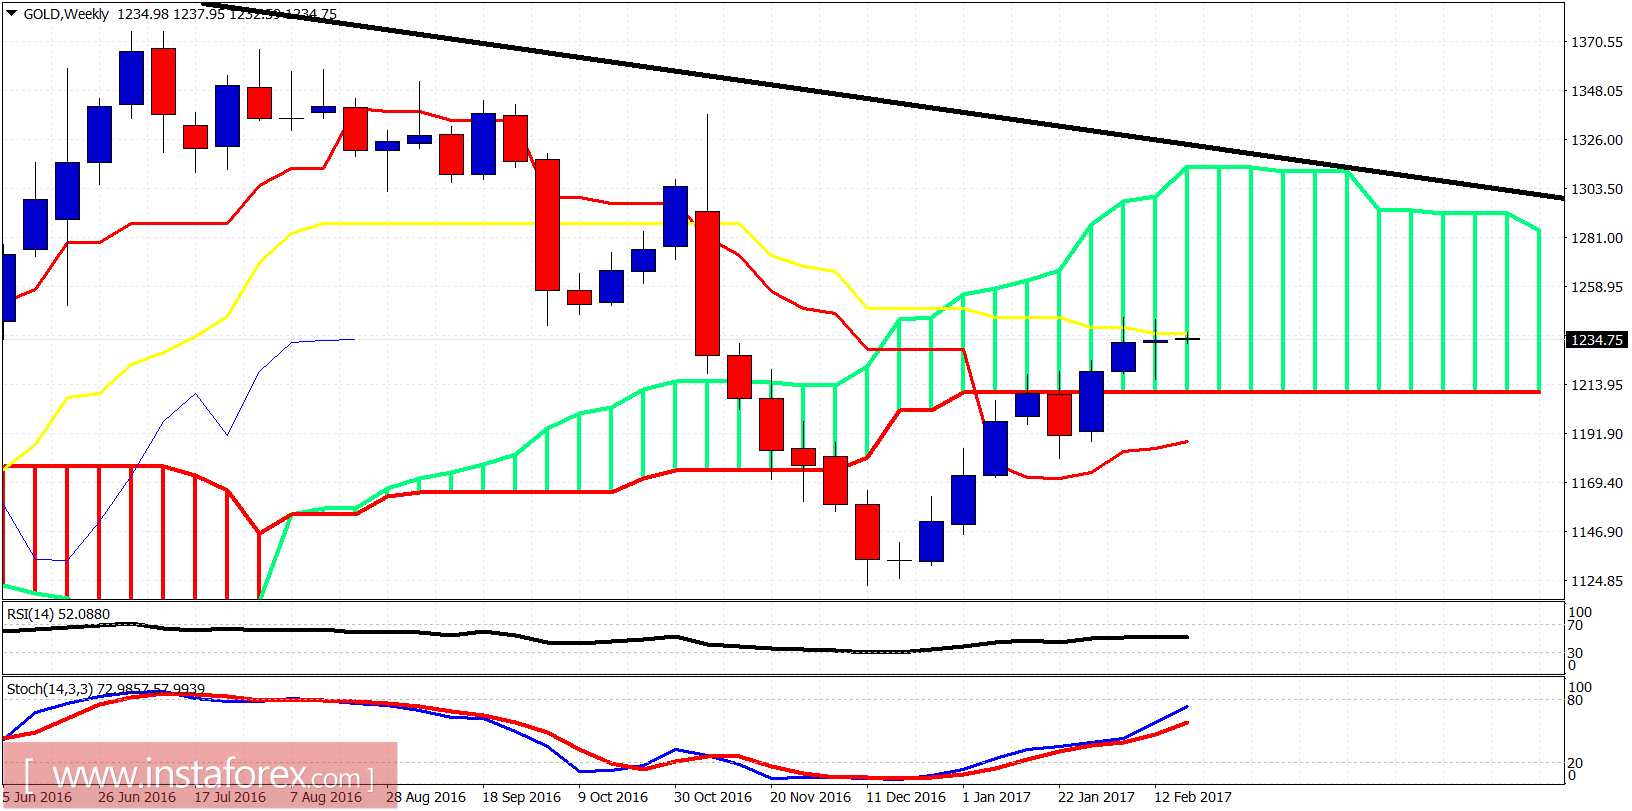
Black line -long-term resistance trend line

The weekly chart last week did not manage to close above the weekly kijun-sen resistance (yellow line indicator). I believe this week bulls will be able to break above it. The upside potential for Gold targets $1,280-$1,320. Trend remains bullish. Only after we reach that are should traders expect a bigger pull back.

Analyst InstaForex
Share this article:
parent
loader...
all-was_read__icon
You have watched all the best publications
presently.
We are already looking for something interesting for you...
all-was_read__star
Recently published:
loader...
More recent publications...