


USDX is being supported by the 200 SMA at H1 chart after the index stayed in sideways during the US holidays on Monday. The resistance level of 101.43 is still a feasible target to the upside, as long as USDX remains trading above that moving average. However, if the index breaks the 100.44 level, then we can expect further declines to test the 99.84 level.
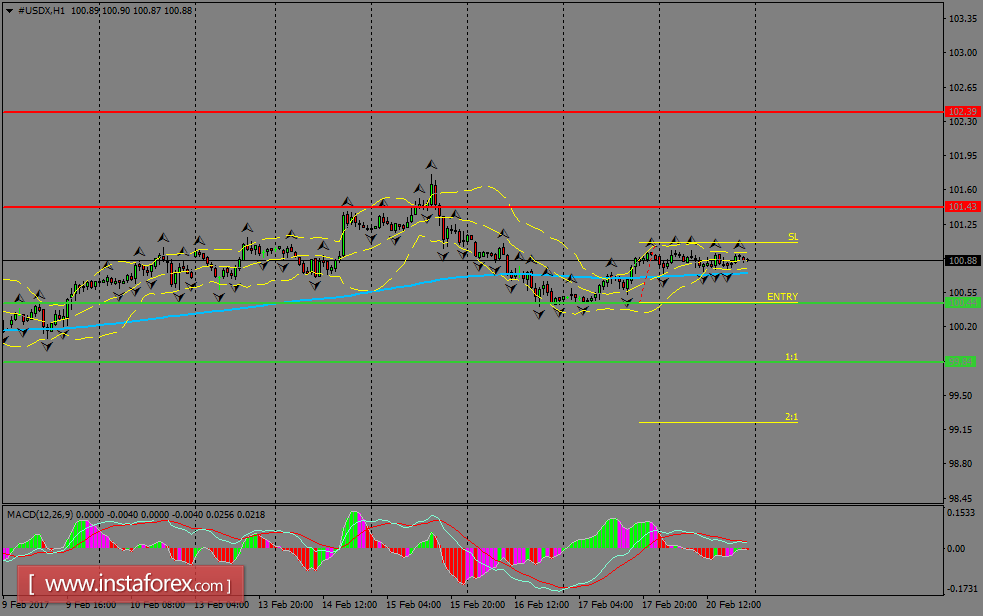
H1 chart's resistance levels: 101.43 / 102.38
H1 chart's support levels: 100.44 / 99.84
Trading recommendations for today: Based on the H1 chart, place sell (short) orders only if the USD Index breaks with a bearish candlestick; the support level is at 100.44, take profit is at 99.84 and stop loss is at 101.06.


