Trading plan for 23/02/2017:
On Thursday 23rd of February, there will not be many economic releases during the European and American trading sessions and the main focus will be on Unemployment Claims data from the U.S. at 01:30 pm GMT and Crude Oil Inventories data at 04:00 pm GMT.
EUR/USD analysis for 23/02/2017:
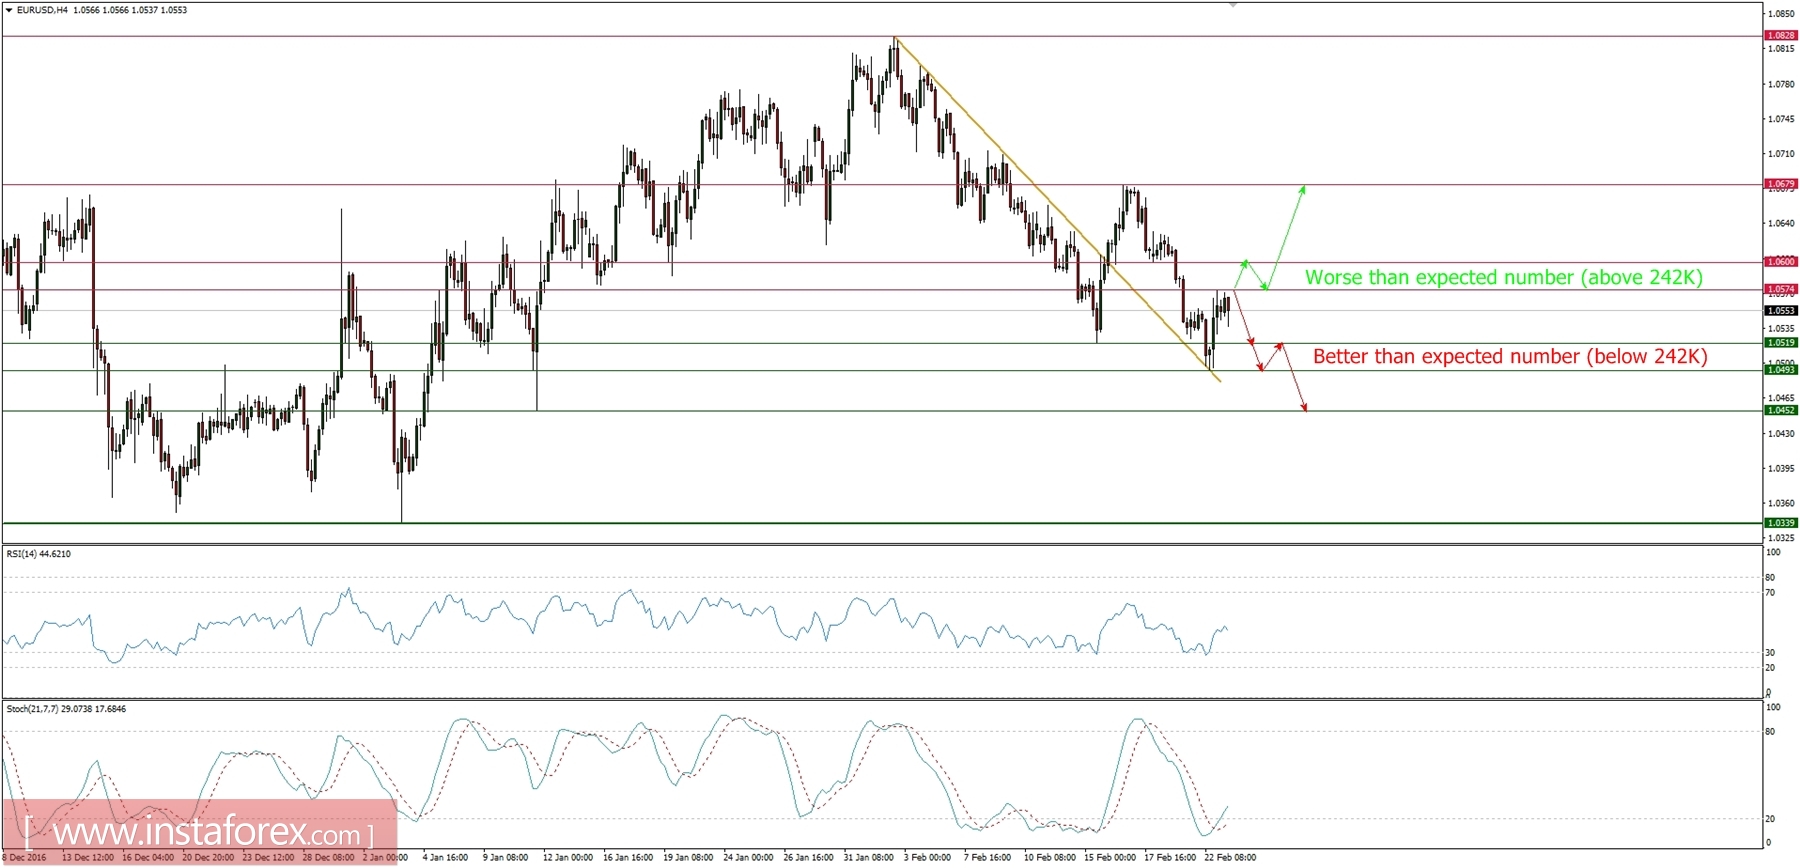
The U.S. jobs market remains strong (unemployment rate below 5.0%, NFP figure above 200k, increase in wages etc.) and today's data have a chance to deliver another evidence of this fact. Market participants expect a slight increase in claims to the level of 242k from 239k a week ago, however, any number lower than 242k will be better for the U.S. Dollar all in all.
Let's take a look at the EUR/USD technical picture in the H4 time frame. The golden trend line has been tested from the above, but there is no indication of any rally continuation yet. Nevertheless, the market is trading in oversold conditions and the bullish divergence still indicates a possible move towards the next technical resistance at the level of 1.0600. Moreover, any U.S. jobs data lower than 242k will spark the even move higher.
Crude Oil analysis for 23/02/2017:
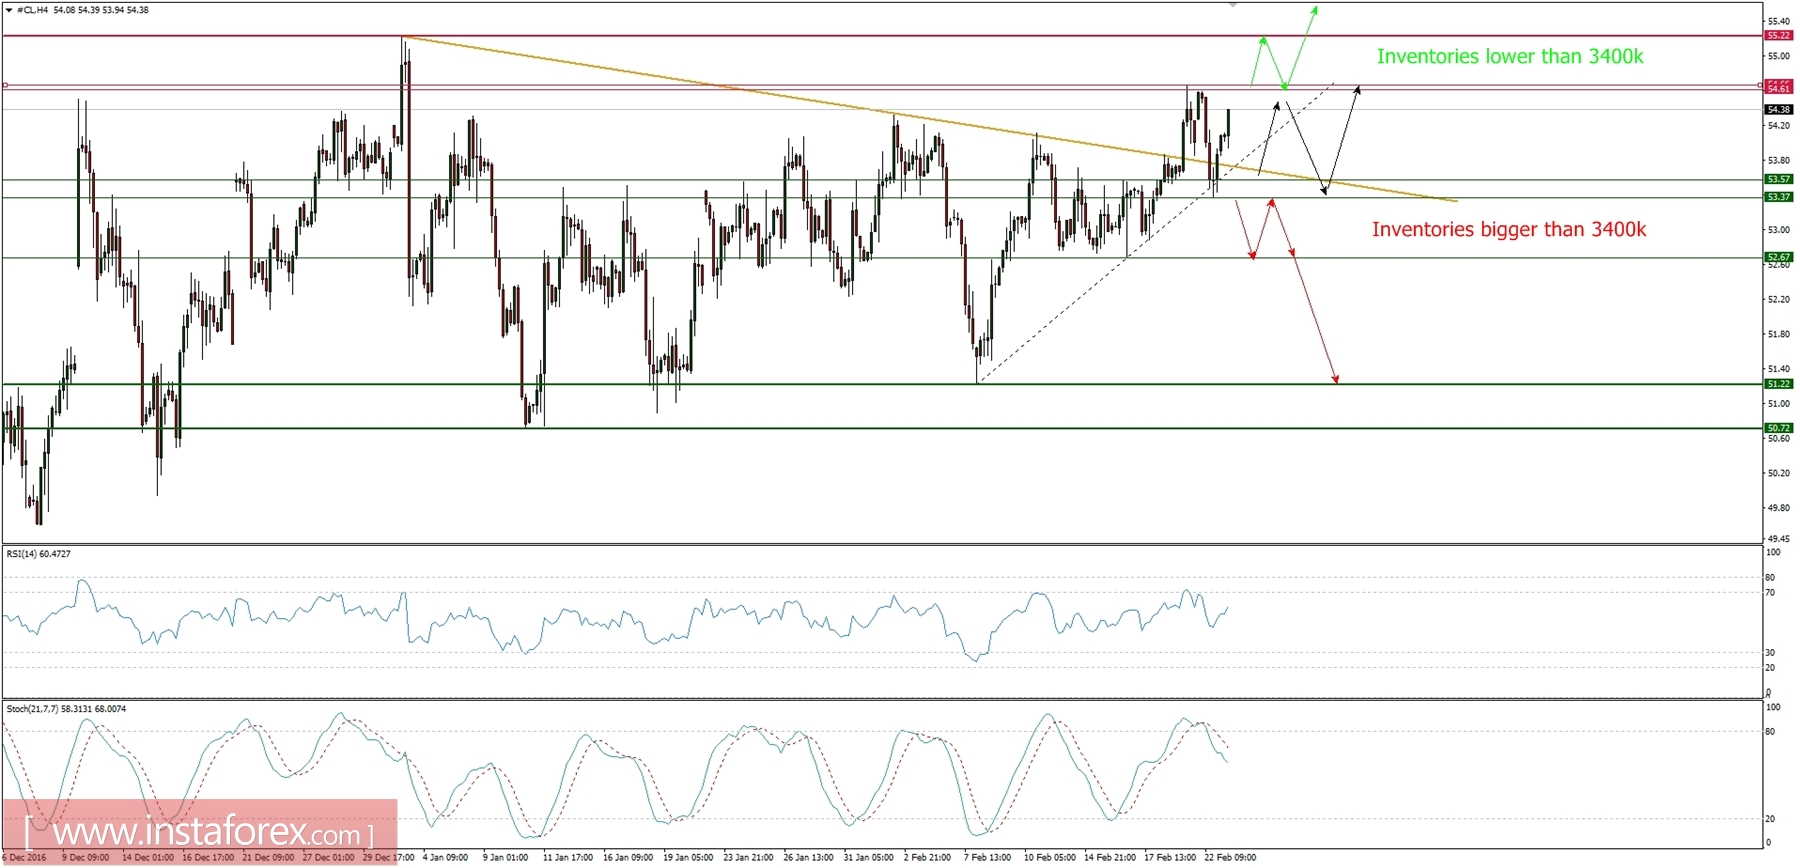
The Crude Oil inventories data are expected to be lower than the last week's gain of 9,527k barrels as market participants expect a rise of 3,400k barrels. As we remember, yesterday OPEC Secretary-general Mohammad Barkindo said that compliance rate among cartel members who agreed to participate in the production cutback deal is expected to increase above the current 90%. However, in the short term, the global crude oil supplies might still be increasing contrary to market participants' expectations.
If the stockpiles again surpass market expectations of a 3,400k rise (1-2 standard deviations higher), then oil price might start to decline. The H4 time frame chart is still range bounded as the price is bouncing from the technical support at the level of 53.37 and reversing at the technical resistance of 54.61. Only a sustained breakout of this zone might be a real game changer here, otherwise, the price will keep trading sideways.
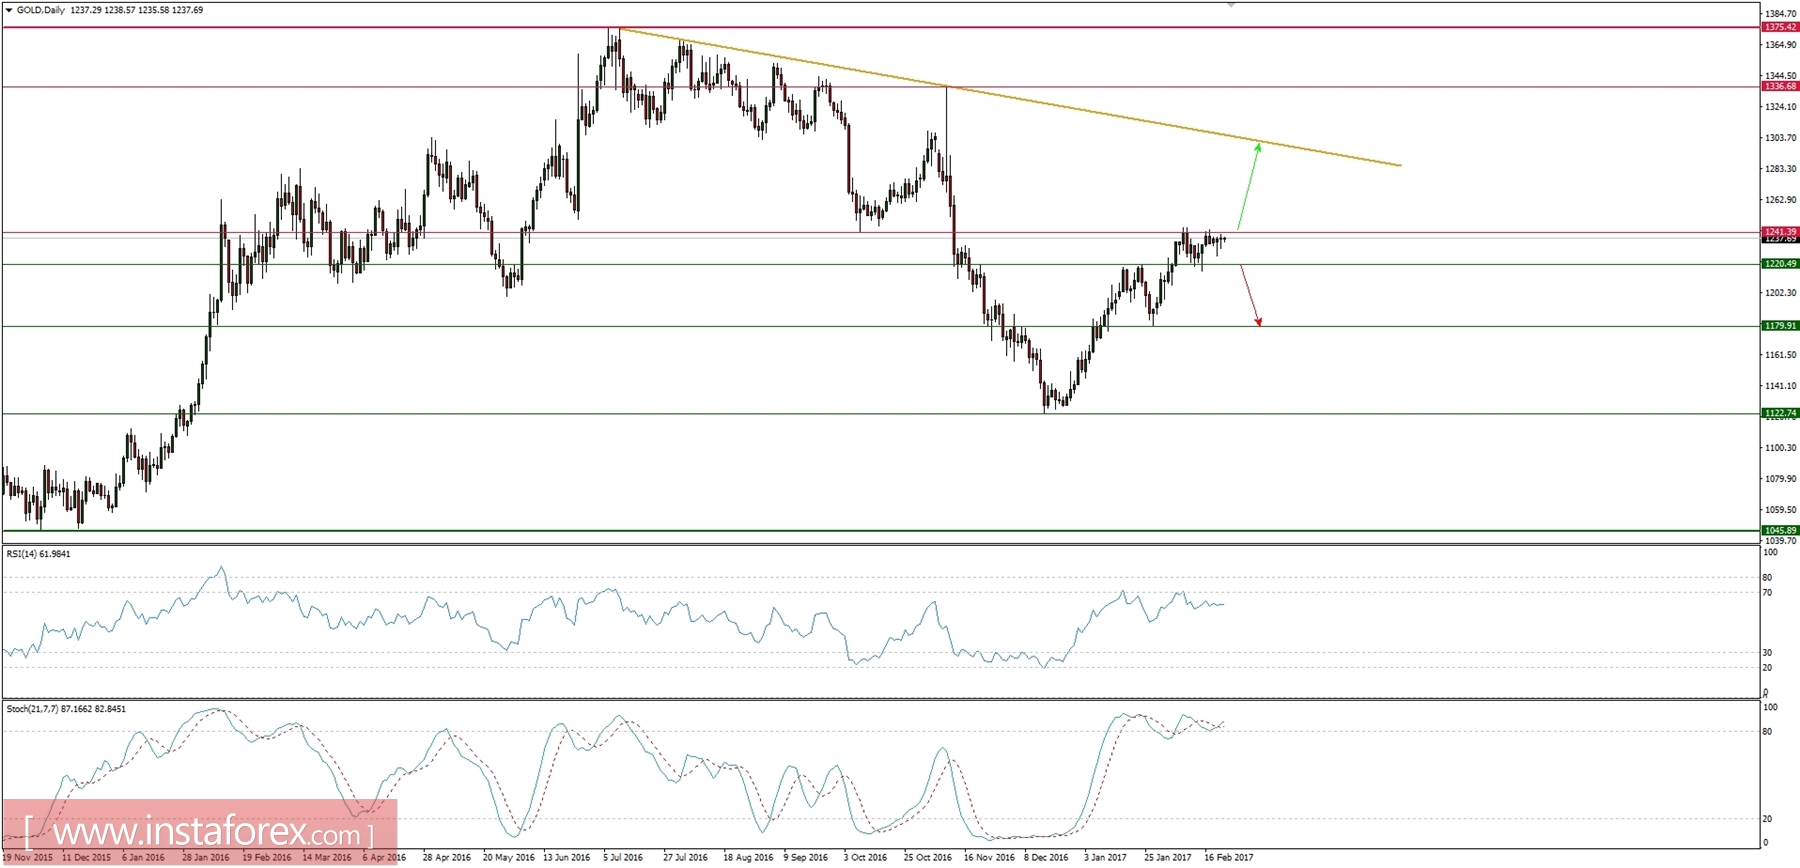
Market snapshot - On Thursday 23rd of February: Gold still trading in overbought area
The narrow zone between the technical support at $1,220 and the technical resistance at $1,241 is currently the most important area on the daily chart. The market conditions are still overbought and only a slight correction was made a week ago to test the level of $1,220. Moreover, the bearish divergence is still clearly visible in this time frame, so the bias is to the downside as long as no new daily candle close is made above $1,241.