


The index is finding dynamic support around the 200 SMA on the H1 chart, following a bearish momentum received during Thursday's session. If the USDX manages to break yesterday's lows, then it can test the 100.44 level, where a breakout should deliver more bears to test the 99.84 level. The MACD indicator is reaching oversold conditions, which should be the next step to resume the bullish bias soon.
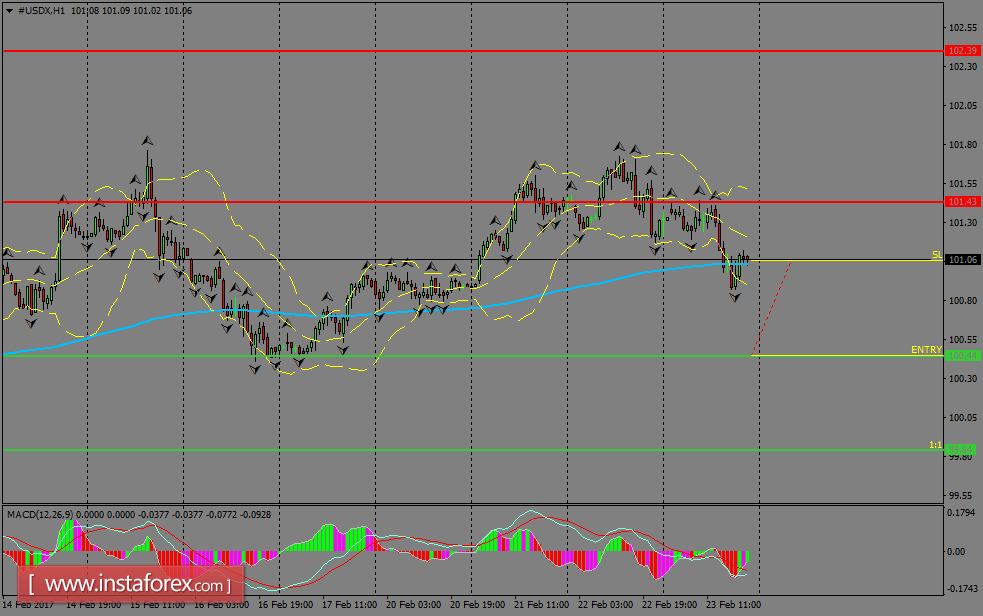
H1 chart's resistance levels: 101.43 / 102.38
H1 chart's support levels: 100.44 / 99.84
Trading recommendations for today: Based on the H1 chart, place sell (short) orders only if the USD Index breaks with a bearish candlestick; the support level is at 100.44, take profit is at 99.84 and stop loss is at 101.06.


