


Cable was capped by the 200 SMA during Monday's session, as the pair tried to recover above that moving average in order to cling up toward 1.2546, which is our first key resistance across the board in a technical view. However, as long as GBP/USD remains below that zone, we can expect a decline to test the 1.2360 area.
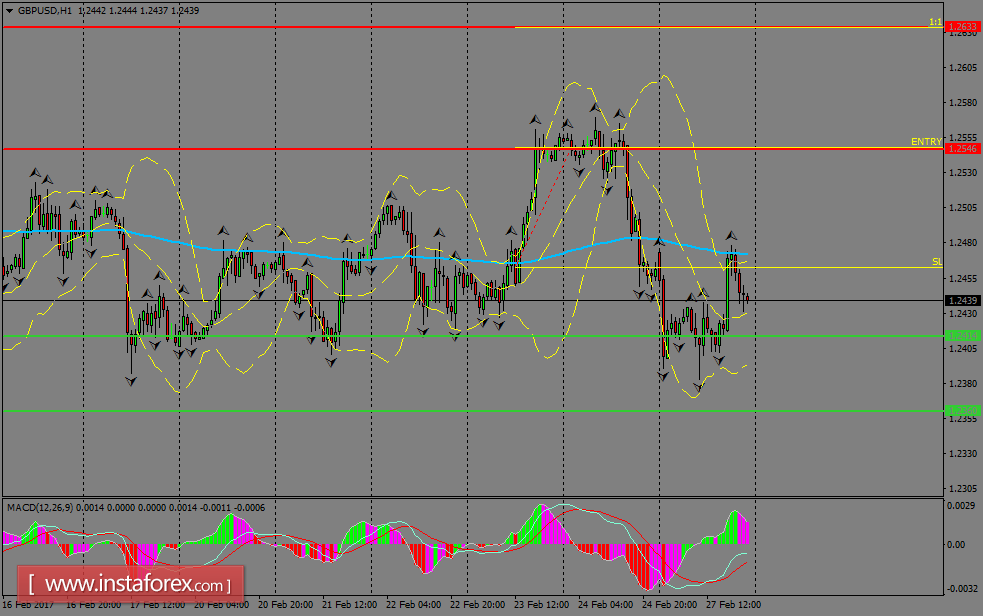
H1 chart's resistance levels: 1.2546 / 1.2633
H1 chart's support levels: 1.2414 / 1.2360
Trading recommendations for today: Based on the H1 chart, buy (long) orders only if the GBP/USD pair breaks a bullish candlestick; the resistance level is at 1.2546, take profit is at 1.2633 and stop loss is at 1.2462.


