


Despite the new high yesterday gold was weak and closed below $1,255 after heavy selling pressures. Despite the pullback the price remains in an uptrend. Even a pullback towards $1,245 will not harm our bullish view and target of $1,280-$1,320.
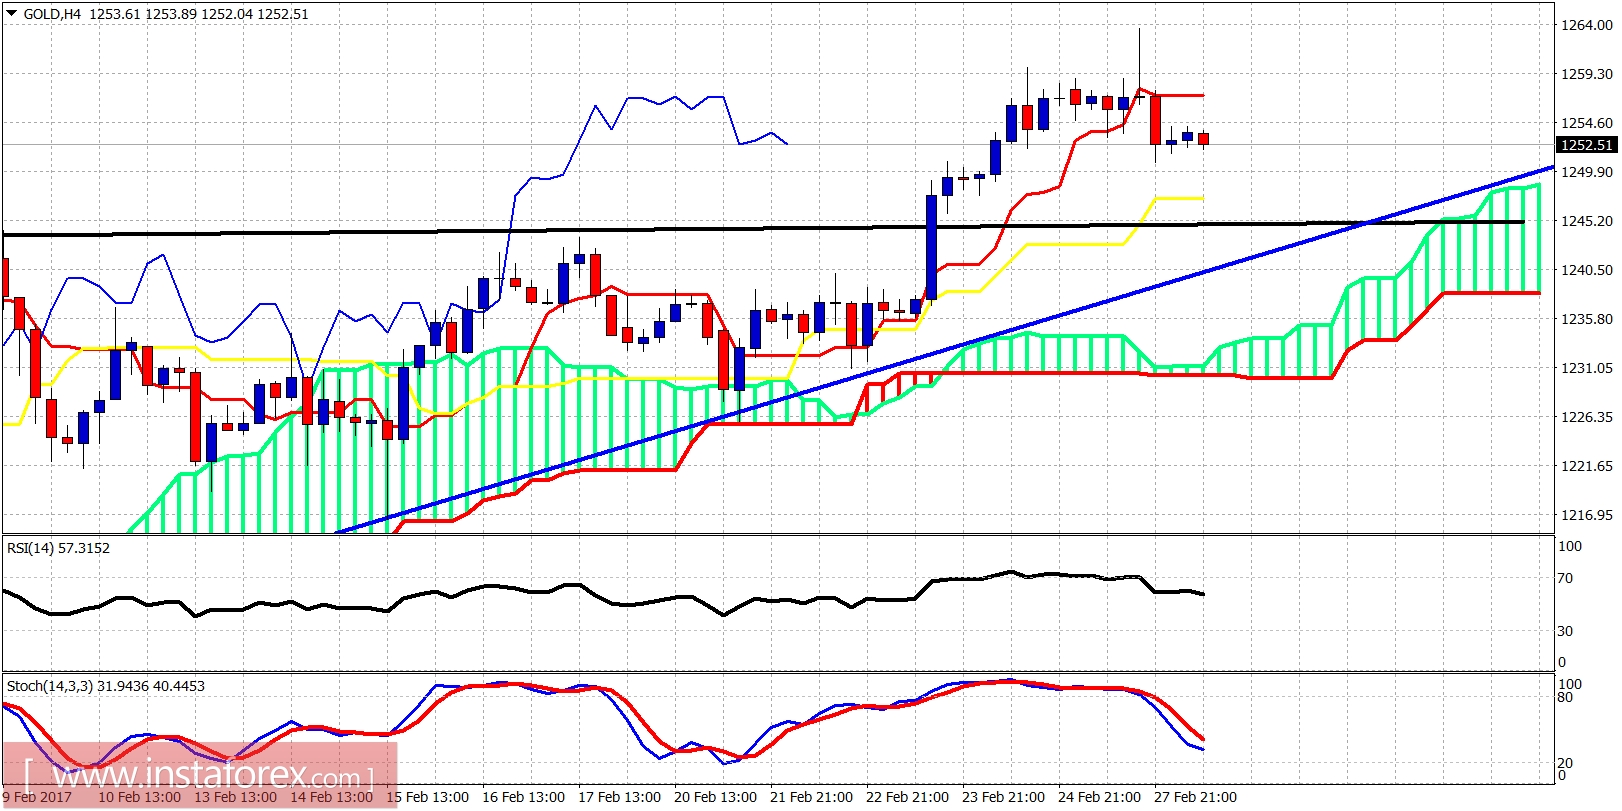
Blue line - long-term trendline support
Gold is trading above the 4-hour Ichimoku cloud support. The price has broken above resistance at $1,245 and we cannot rule out a back test of that area which is now support. The price has broken below the tenkan-sen (red line indicator). Short-term resistance is at $1,257 and support is at $1,247.
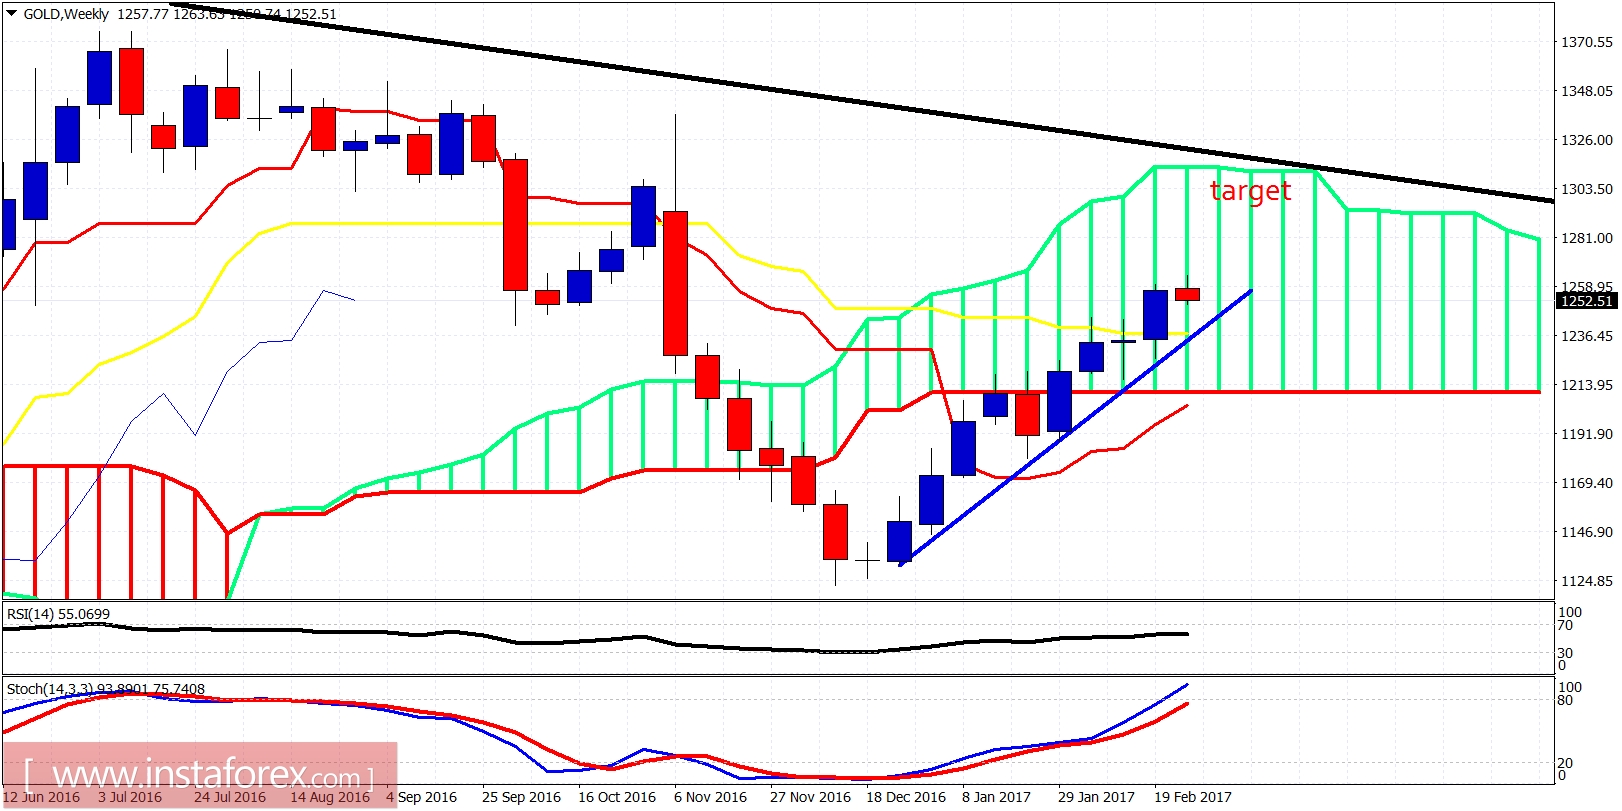
Blue line - long-term support
The price is trading above the blue trendline support and targets the upper cloud boundary and the black trendline resistance at $1,300. The price is above the weekly kijun-sen (yellow line indicator). Short-term trend is bullish. Oscillators have no worrying signs yet and still are not in overbought levels. Upside move in Gold is far from over.


