


The Dollar index remains in a bullish trend and has broken above 102. Today's close is very important. If the bulls manage to keep hold of the trend, then we can say that at 99.25 we see an important medium-term low. Target remains at 105-110.
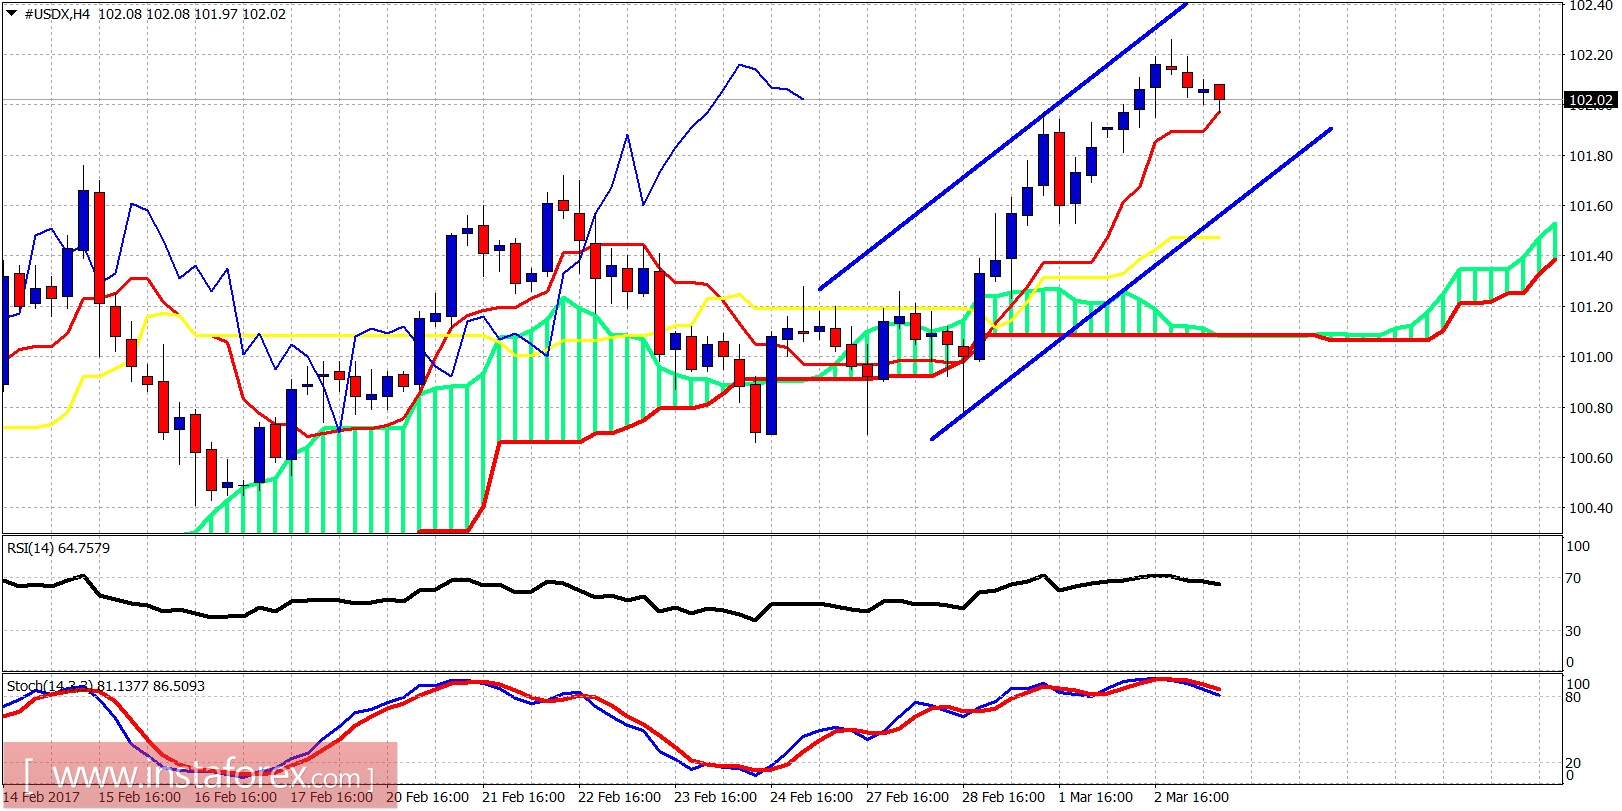
The Dollar index is making higher highs and higher lows. There are bearish divergence signs in the 4-hour chart shown above. Short-term support is at 101.50 and resistance at 103. Trend will change on a break below 101.10.
Green line - long-term support trend line
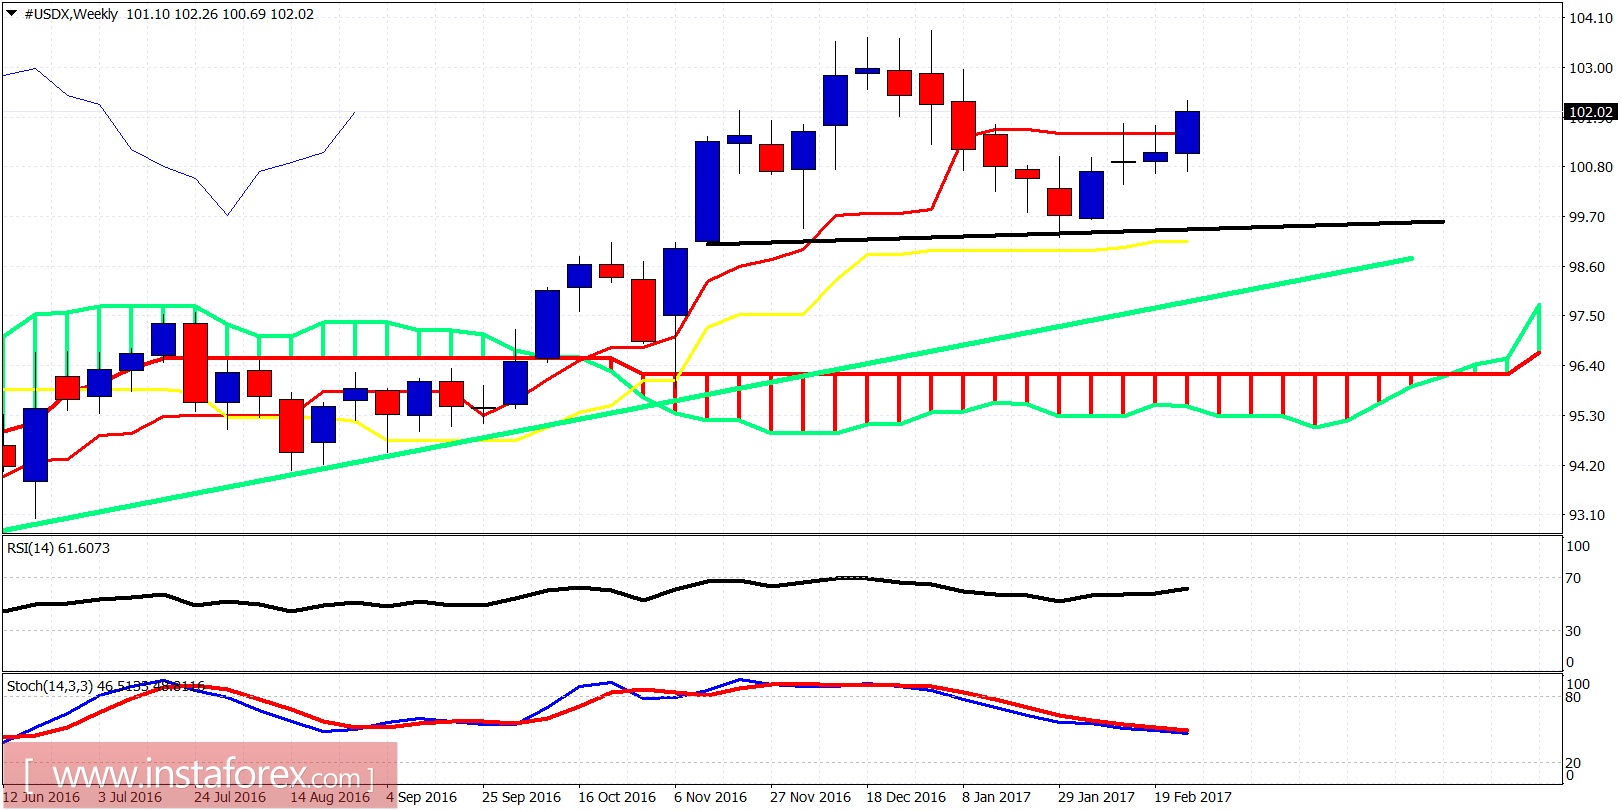
The weekly chart remains bullish as the price is trying to break above the tenkan-sen (Red line indicator). Weekly support is at 100.70. Next weekly resistance is at 103.70. It is crucial to see where this week closes. So far the bulls remain in control.


