


Gold remains weak but above $1,220 support. Short-term trend remains bearish. Gold is in danger of making a bigger than expected pullback towards $1,180 before resuming the uptrend towards $1,300.
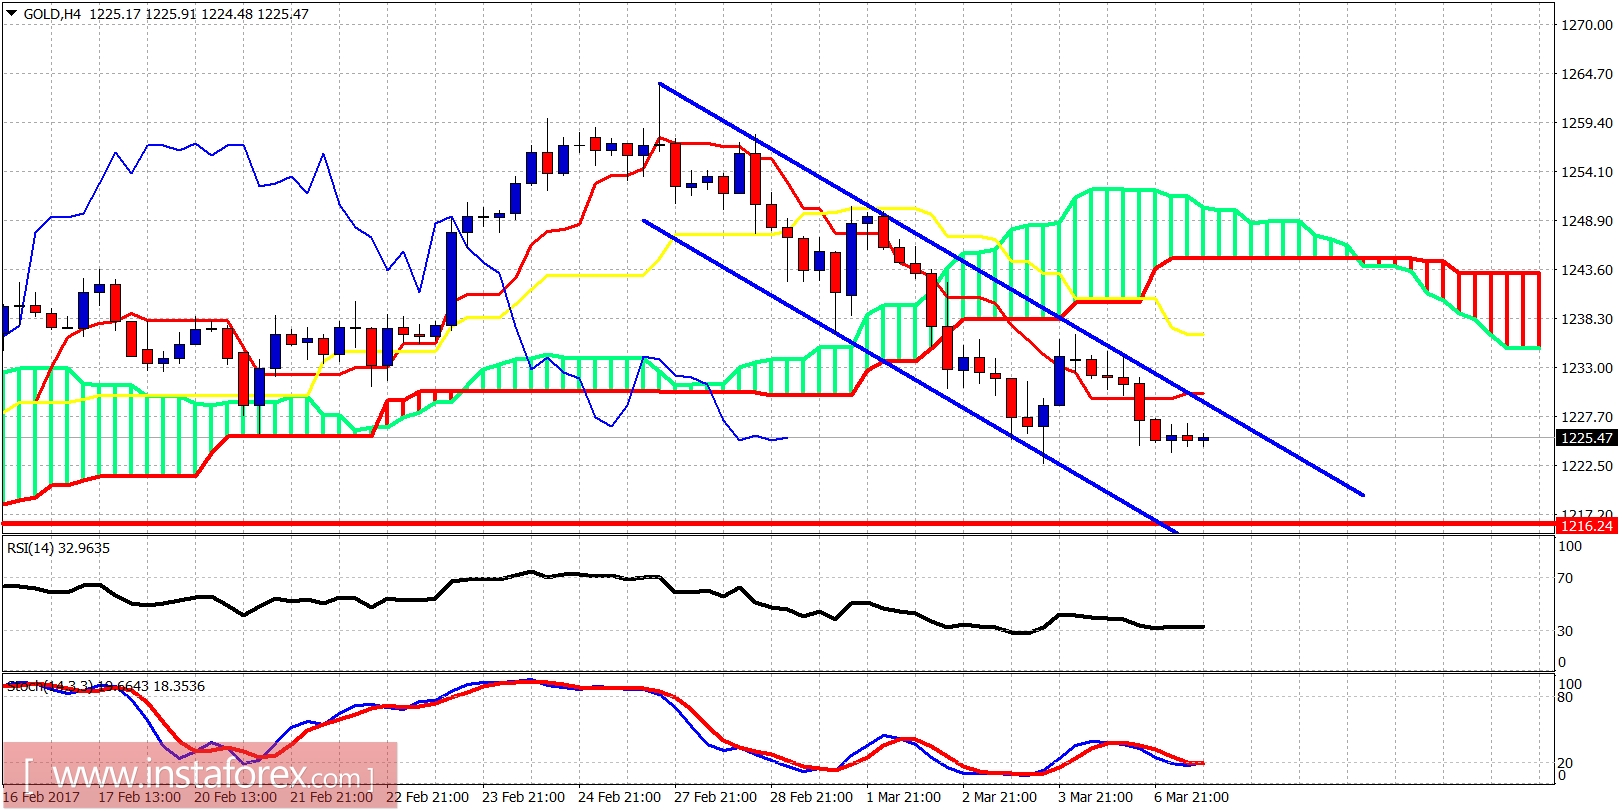
Gold is trading below the Ichimoku cloud and inside the blue bearish channel shown above in the 4-hour chart. As long as the price is below $1,250, the trend is bearish. Short-term resistance is at $1,228 and the next is at $1,237. Support is at $1,216 and the next one is at $1,180.
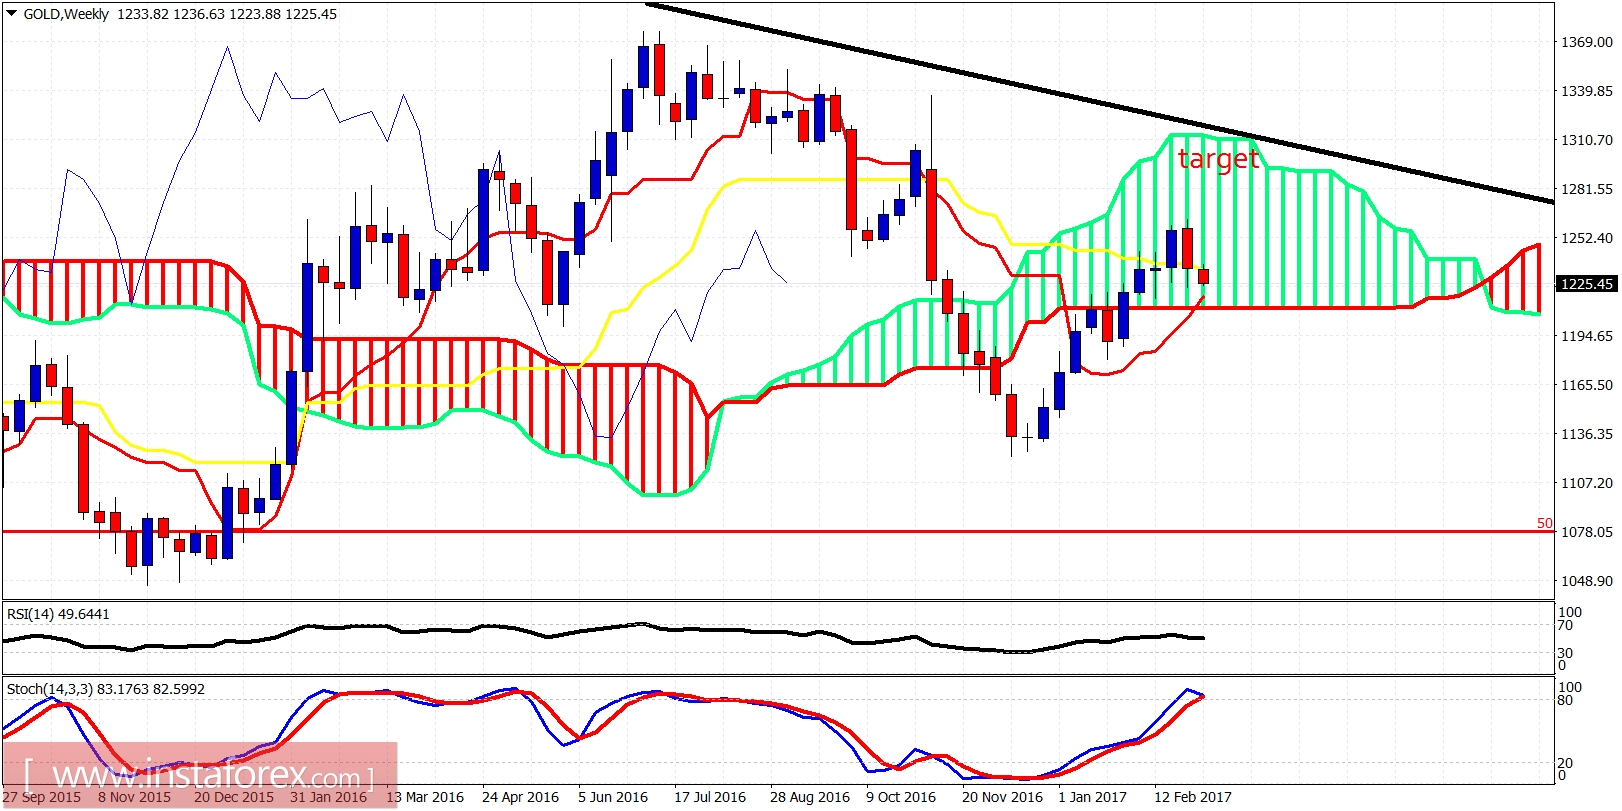
Gold weekly chart is testing the weekly tenkan-sen (red line indicator) support. The price is inside the cloud. There is no weekly bearish divergence. Gold is most probably making a deeper correction that could even push towards $1,180 but is still expected to make a move towards $1,300.


