


USDX is finding dynamic support around the 200 SMA on H1 chart, looking for a catalyst to reach the 102.39 level. If a breakout happens over there, then another bulls' wave could appear in order to test the 103.40 level, which is our next key interest area to the upside. The support zone of 101.39 could give up in the process. If we witness such scenario, the 100.44 level could be the next target to the downside.
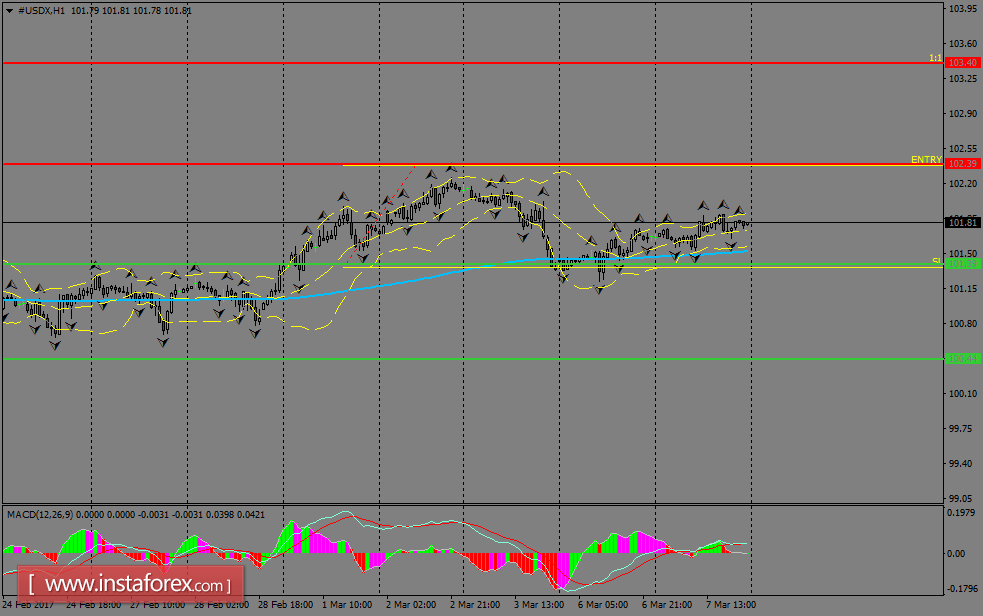
H1 chart's resistance levels: 102.39 / 103.40
H1 chart's support levels: 101.39 / 100.44
Trading recommendations for today: Based on the H1 chart, place buy (long) orders only if the USD Index breaks with a bullish candlestick; the resistance level is at 102.39, take profit is at 103.40 and stop loss is at 101.35.


