


The US dollar index is moving higher but still below the important resistance of 102.30. The trend remains sideways as the price is trapped inside the trading range of 102.20-100.50. However, bulls still have more chances of success as in longer-term charts the price continues to make higher highs and higher lows.
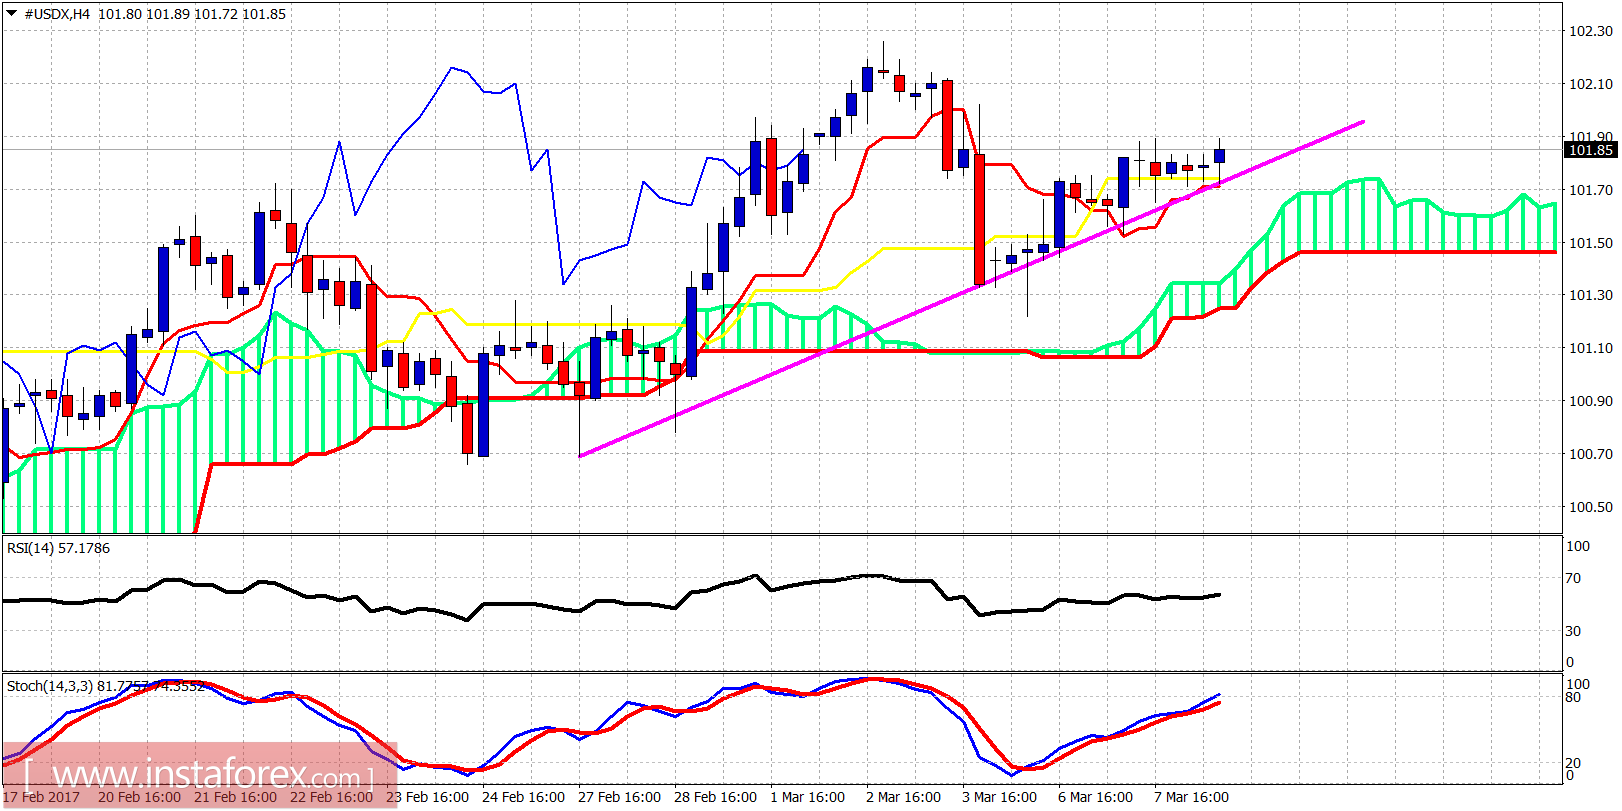
Purple line - short-term support
The US Dollar index is trading above the Ichimoku cloud. The price is also above both the tenkan- and kijun-sen (red and yellow line indicators). The short-term support is at 101.70. Resistance is at 102.30.
Green line - long-term trend-line support
Red line - resistance
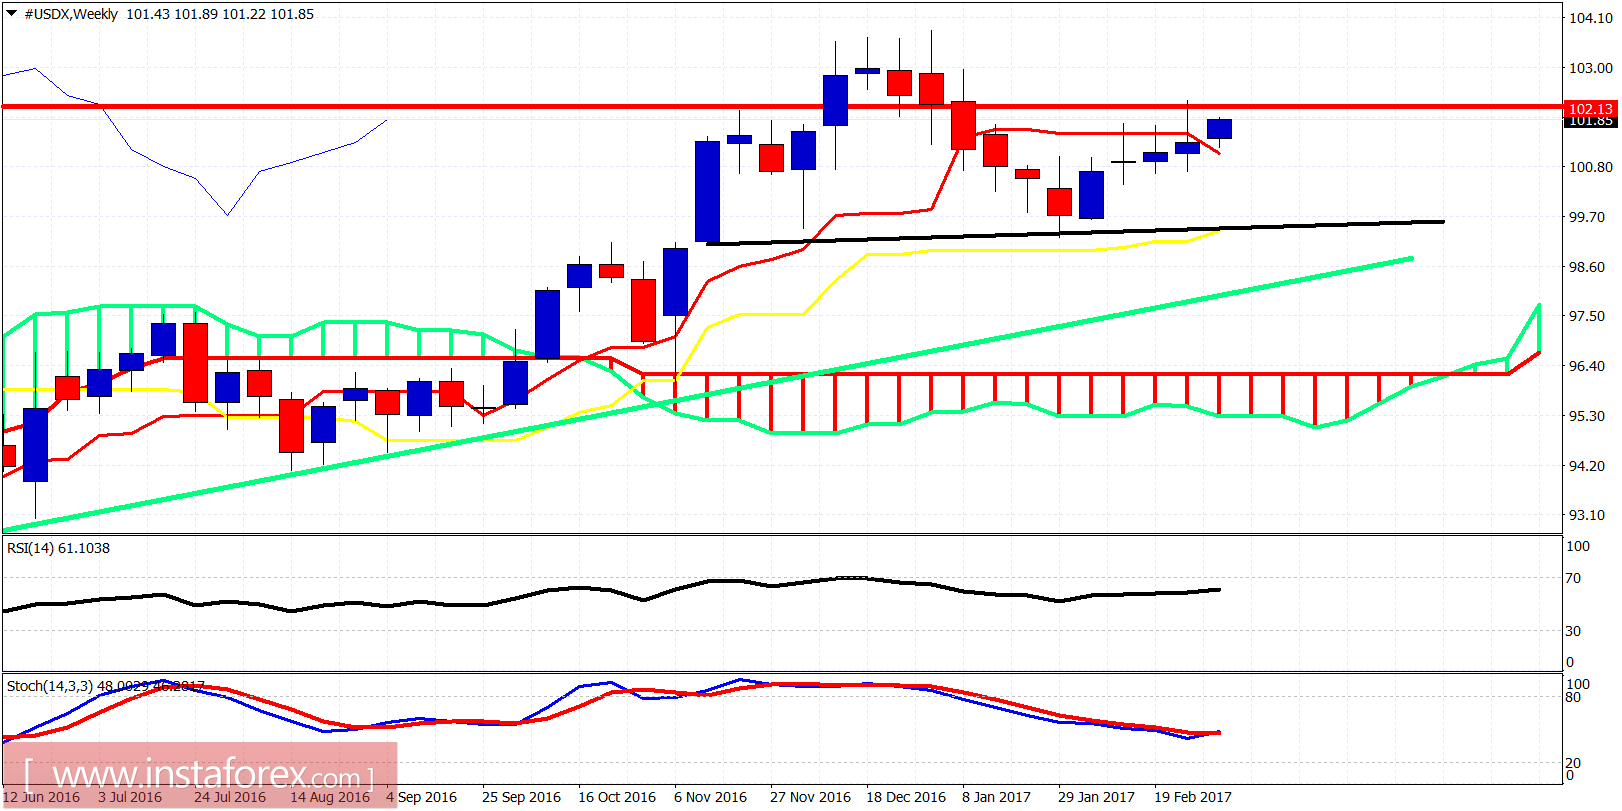
Weekly support is held. The price is above the weekly tenkan-sen (red line indicator). As long as the price is above 101, the short-term trend remains bullish. As long as the price is below 102.30 and above 100, the trend is neutral. So far weekly support is held and that is why the longer-term trend remains bullish.


