


The Dollar index is trying to break resistance at 102.20 once again. Short-term trend remains bullish as long as the price is above 101.90. With NFP tomorrow and the ECB today, I would be very cautious as we could see another pullback towards 101 before the resumption of the uptrend.
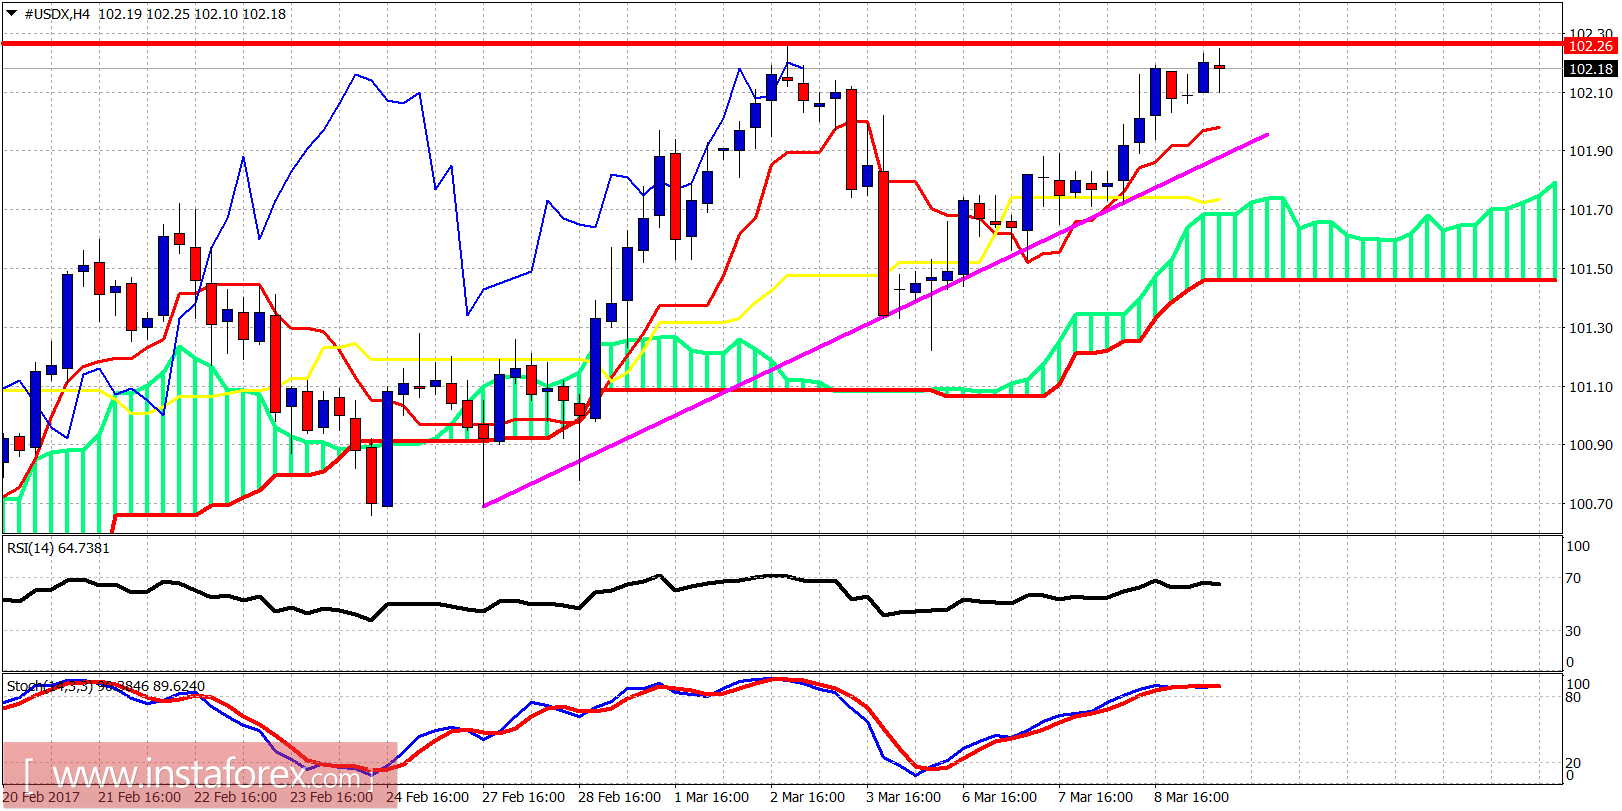
Purple line - support
The Dollar index is overbought and diverging in the short term. Technical resistance is at 102.20 from the previous highs. A double top rejection could be seen at these levels today. A clear break above 102.20 will push the index towards 103.
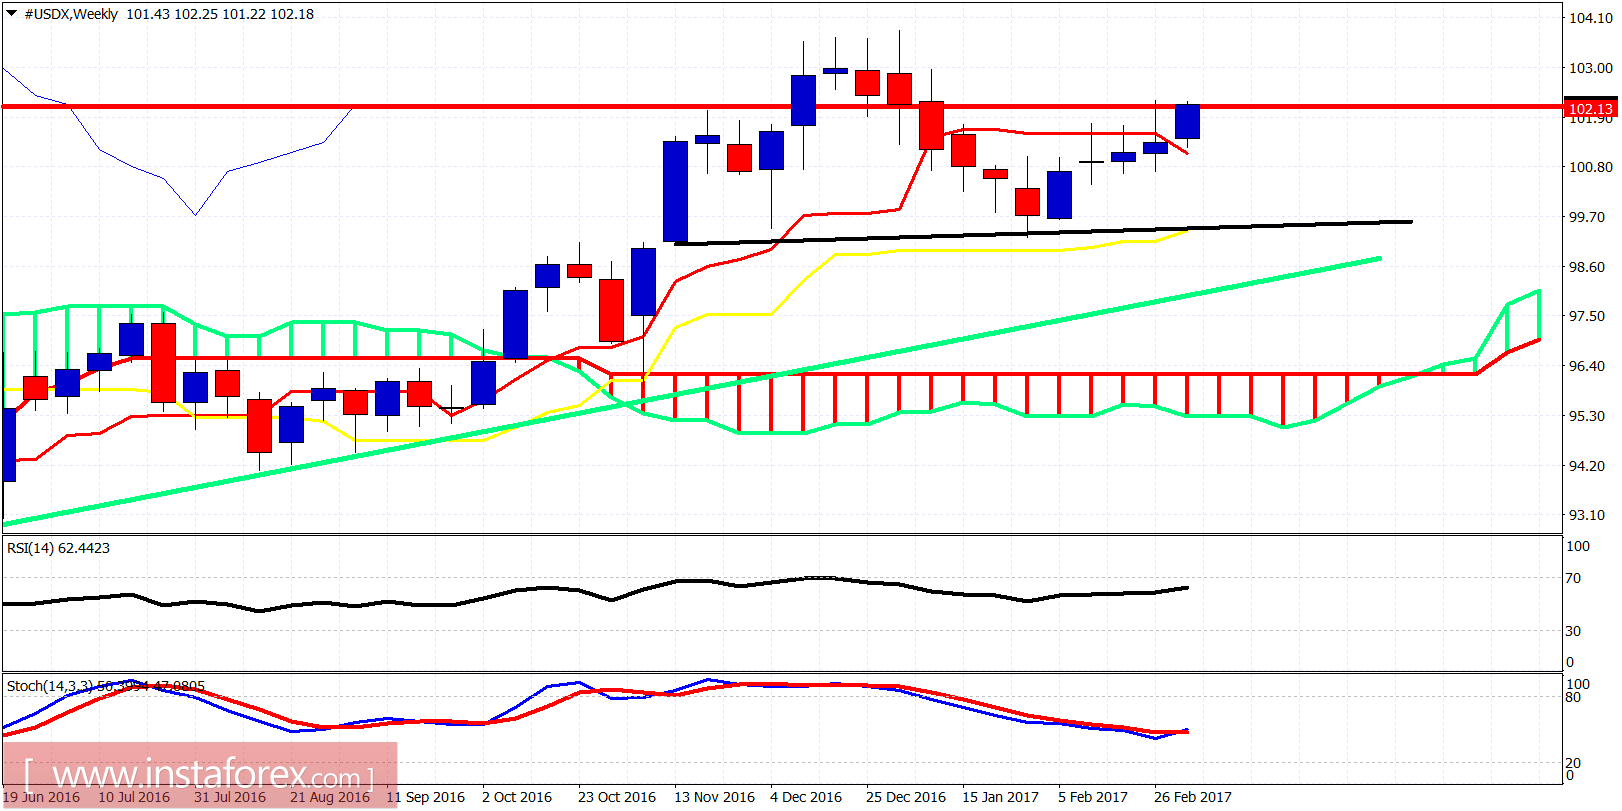
Black line - neckline support
Green line - long-term trend line support
On a weekly basis Gold price remains in a bullish trend and the low at 99.25 is of high importance for the longer-term trend. Weekly support is also found at 100.70. A break below that level will increase the chances of a testing the 99.25 level. On the other hand, the bulls need to hold 101 and break above 102.20 in order to move to the next degree of the uptrend. The bulls are in control. Long-term trend remains bullish.


