Overview:
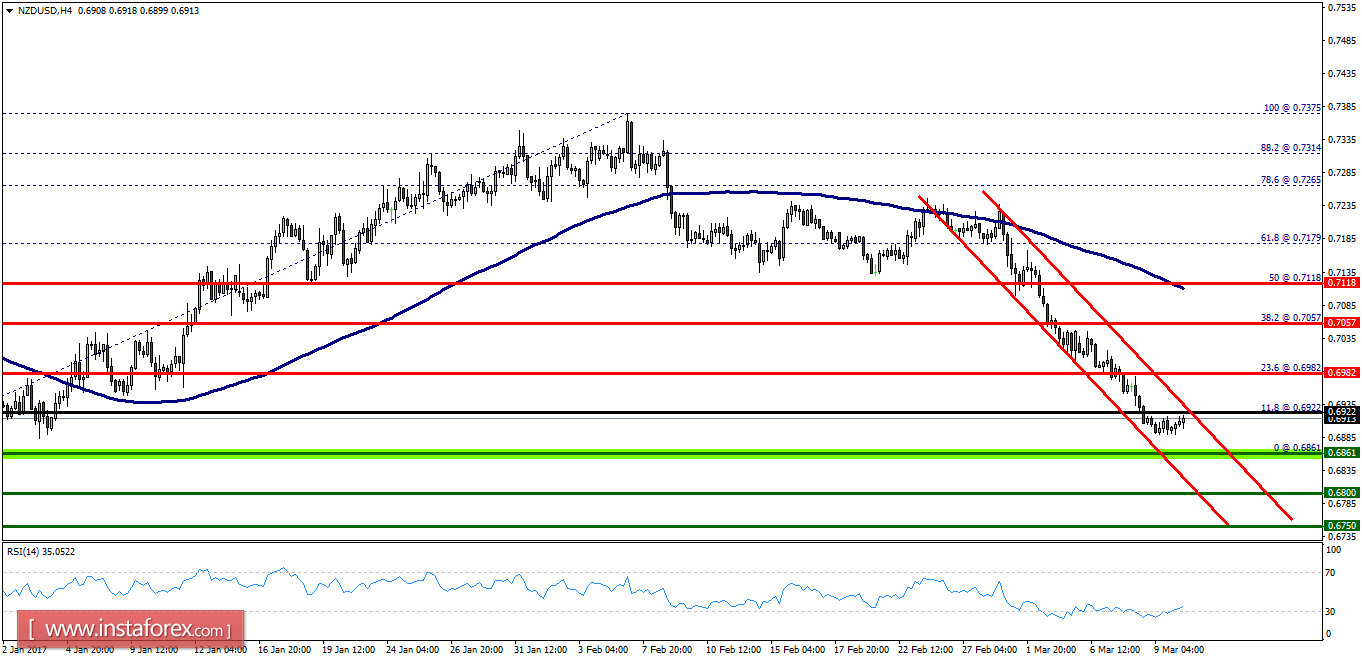
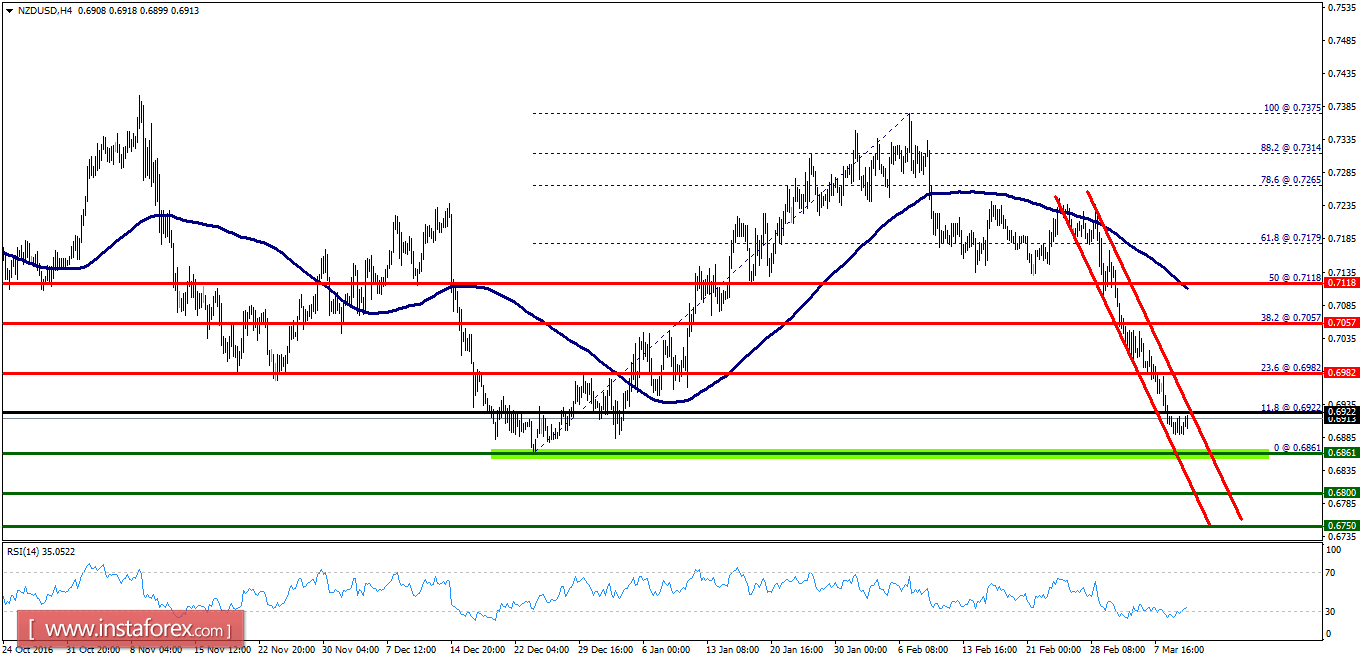
- The NZD/USD pair fell from the level of 0.6982 towards 0.6889. Right now, the price is set at 0.6922. On the H4 chart, the resistance of the NZD/USD pair is seen at the levels of 0.6982 and 0.7057. It should be noted that volatility is very high for that the NZD/USD pair is still moving below the resistance level of 0.6982. Moreover, the price spot of 0.6982 - 0.7057 remains a significant resistance area. Therefore, there is a possibility that the NZD/USD pair will move downside and the structure of a fall does not look corrective. In order to indicate the bearish opportunity below 0.6982, sell below 0.6982 with the first target at 0.6861 in order to test the monthly bottom. It should be noted that support 1 is seen at the level of 0.6861 which coincides with the double bottom. Additionally, if the NZD/USD pair is able to break out the bottom at 0.6861, the market will decline further to 0.6800 in order to test the daily support 2. On the other hand, if a breakout happens at the resistance level of 0.7057, then this scenario may be invalidated.