


USDX continues to find support around 101.39, while it's trying to consolidate below the 200 SMA at H1 chart. If the index does a rebound at the current stage, it can test the 102.39 level and such move could possibly strengthen the bullish bias in the short-term. However, if USDX plummets below 101.39, it can reach the 100.44 level.
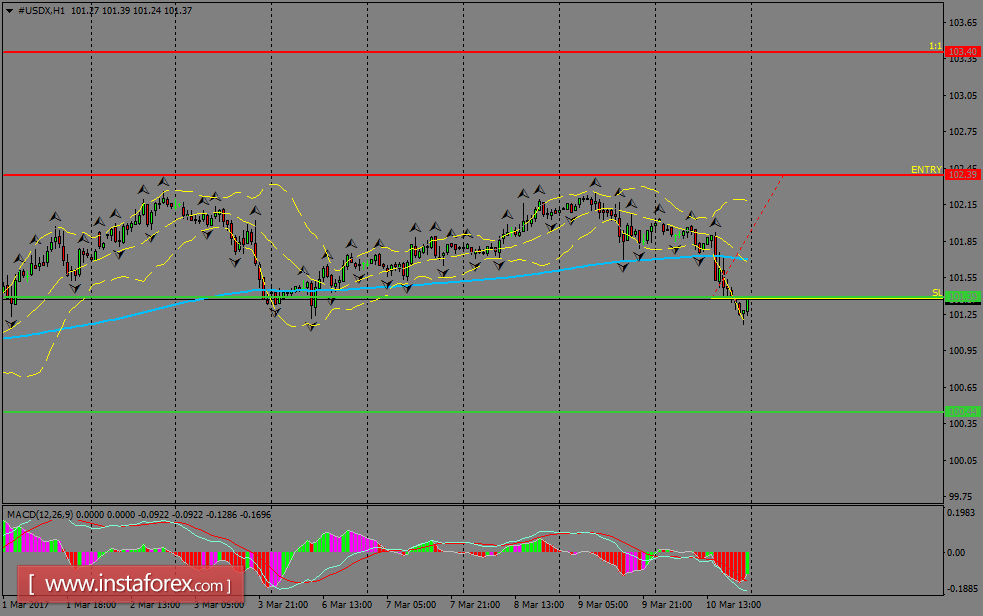
H1 chart's resistance levels: 102.39 / 103.40
H1 chart's support levels: 101.39 / 100.44
Trading recommendations for today: Based on the H1 chart, place buy (long) orders only if the USD Index breaks with a bullish candlestick; the resistance level is at 102.39, take profit is at 103.40 and stop loss is at 101.35.


