


Another bearish reversal and rejection at 102.30. This is not a good sign for the Dollar index. Friday's price action made things worse and the inability to break above resistance is not a good sign. The Dollar index is in bearish short-term trend.
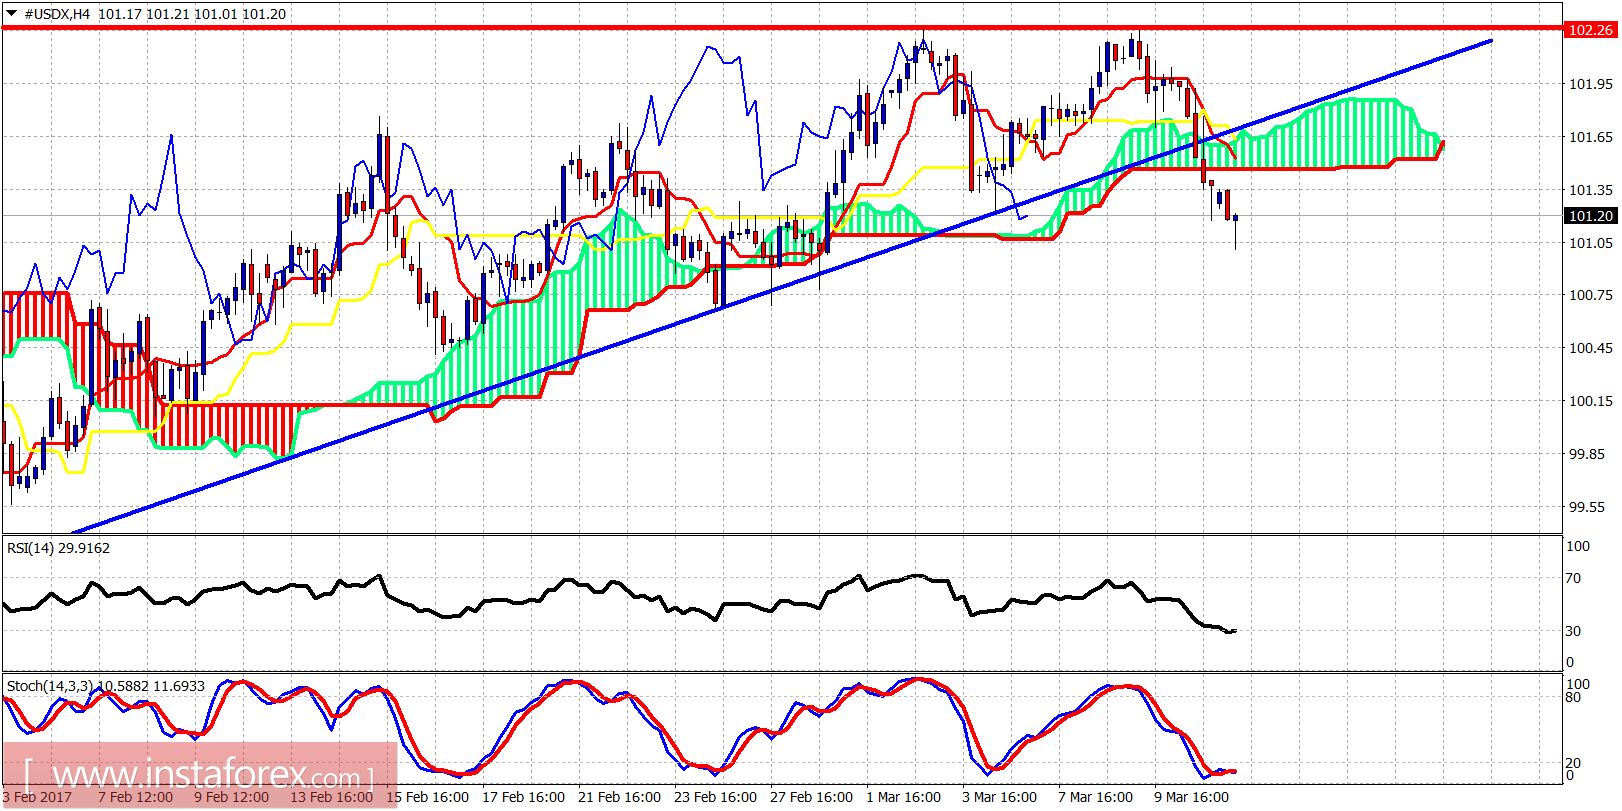
Blue line - support (broken)
Short-term trend line support is broken. Price has also broken below the 4-hour Ichimoku cloud support. We could see a bounce towards 101.30 for a back test of the cloud, but overall I remain bearish the Dollar index. The Double top and the rejection at 102.30 is not a good sign.
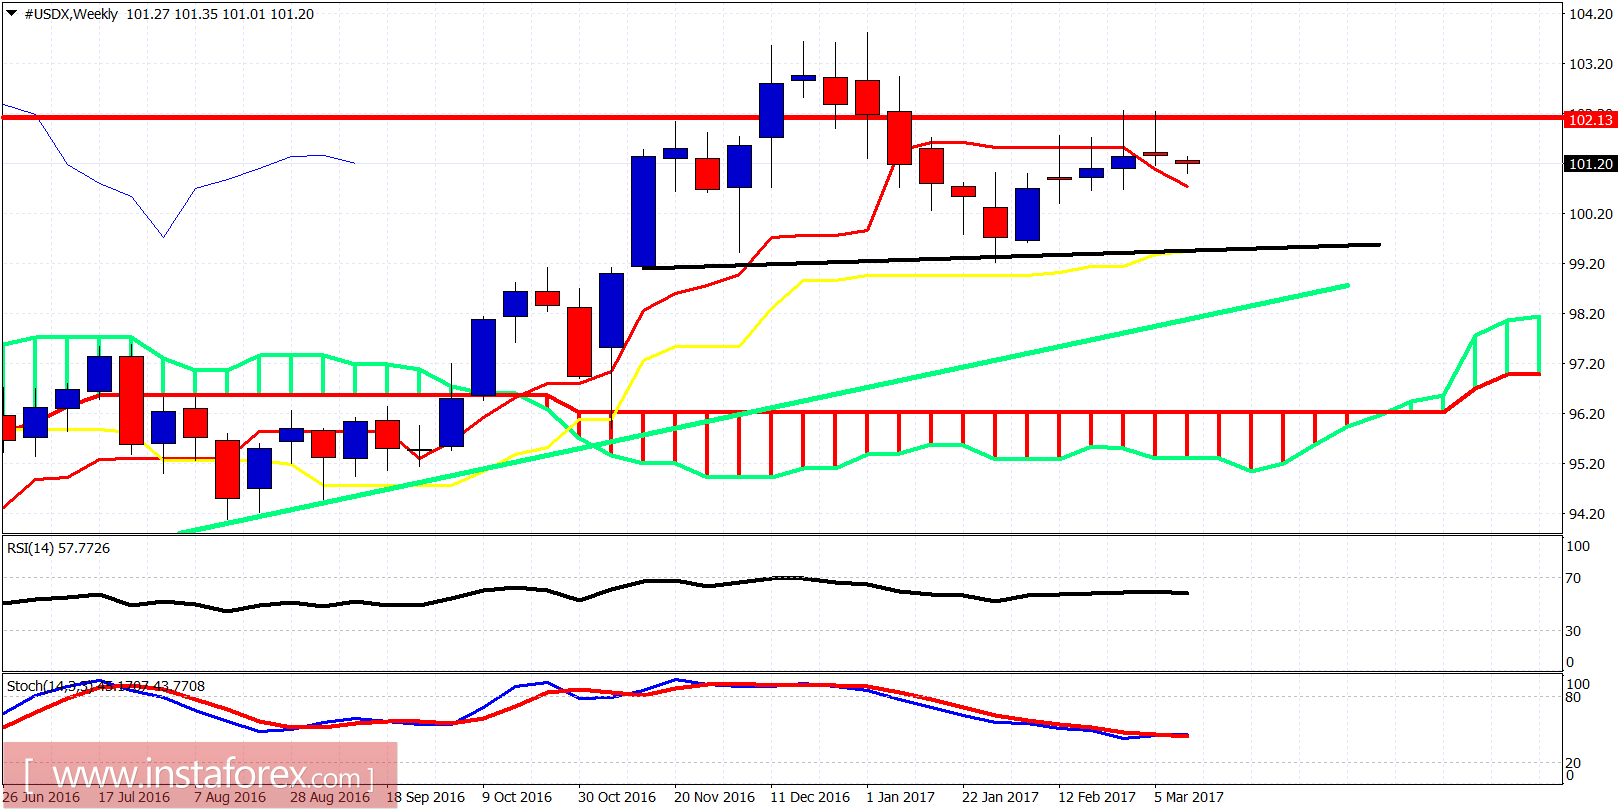
Red line - resistance
Black line - neckline support
Green line - long-term trend line support
The weekly candle was another long upper tail indecisive one, giving more hopes to Dollar bears than confirming the bullish trend. 102.30 remains major resistance. If broken the up trend will continue to new highs. Until then the trend will be in danger of turning bearish. Support at 99.25 is critical, but things will get bumpy for bulls if we break 100.60. So a break below 100.60 will be the first important bearish sign.


