


The Dollar index is bouncing as expected to back test the broken support. As long as price is below 102.30, there is a lot of danger of moving sharply lower towards 100 or even lower. Bears need to break yesterday's lows while bulls need to break above the recent double top.
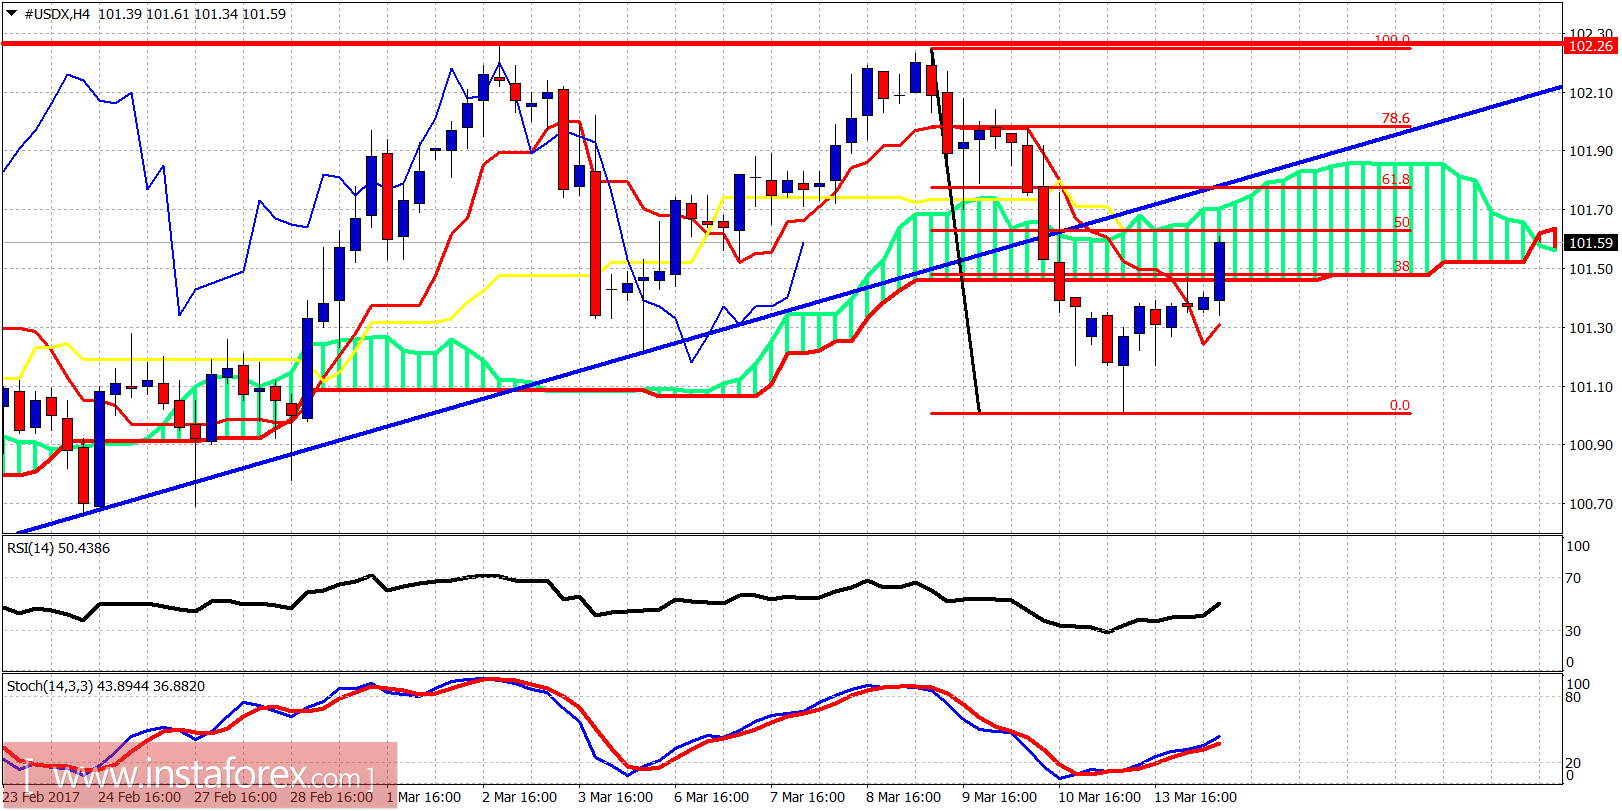
Red line - resistance
The Dollar index is trading inside the Kumo (cloud). Trend is neutral on the 4-hour chart. Resistance is at 101.63 and 101.80 before the big resistance at 102.30. Support is at 101.30 and at 101. Traders better be patient.
Black line - neckline support
Green line - long-term support trend line
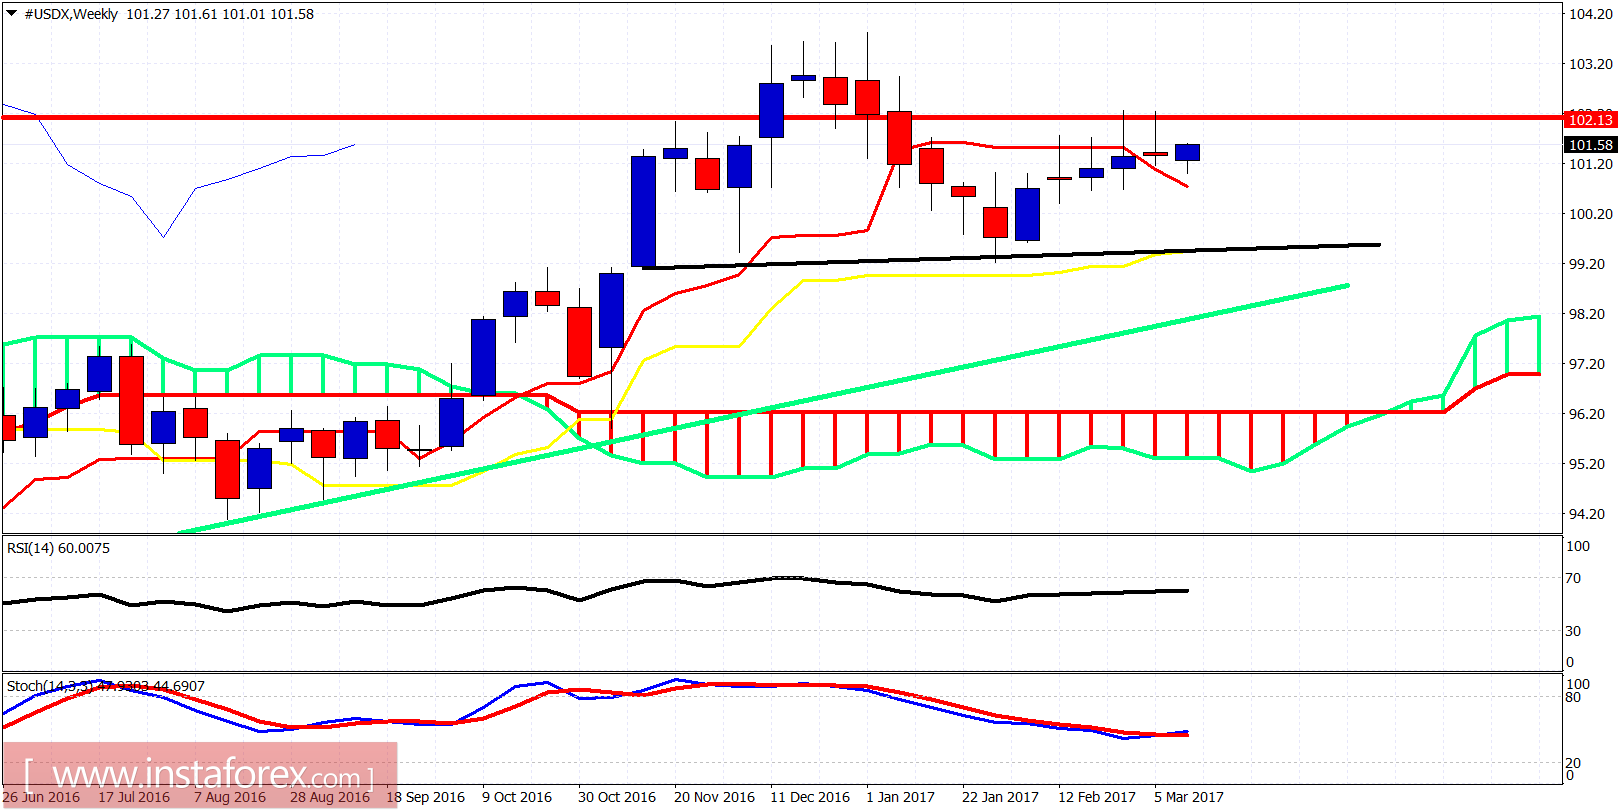
The Dollar index weekly chart remains indecisive as price continues to trade sideways in a tight range between 102.30 and 101. The weekly tenkan-sen support is at 100.75. Weekly kijun-sen support is at 99.45. Weekly resistance at 102.30 remains intact. Market is moving sideways. No clear trend in the short term.


