


The Dollar index as expected made the back test yesterday and reversed after being rejected at 101.80. Short-term trend is bearish and volatility is expected to rise today after the FOMC announcement.
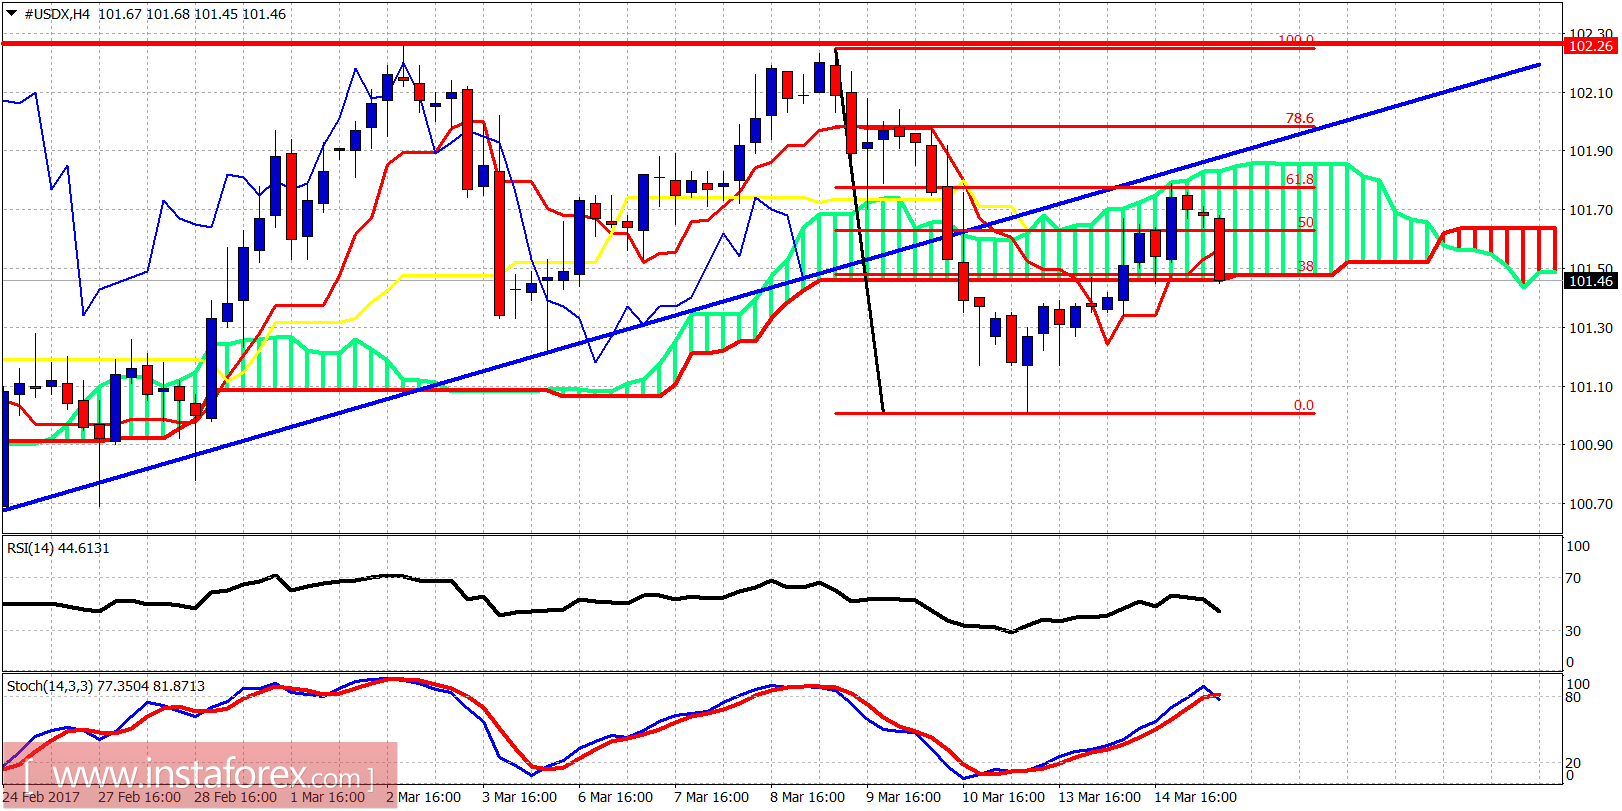
Blue line - support (broken)
The Dollar index back tested the broken blue trend line as expected and got rejected at the 61.8% Fibonacci retracement level. Price is now trying to break below the 4-hour Ichimoku cloud. The Dollar index has made a lower high yesterday relative to the recent highs at 102.30. A new low below 101 will be a bearish sign for more selling pressures to come over the coming weeks.
Red line - resistance
Black line - neckline support
Green line - long-term trend line support
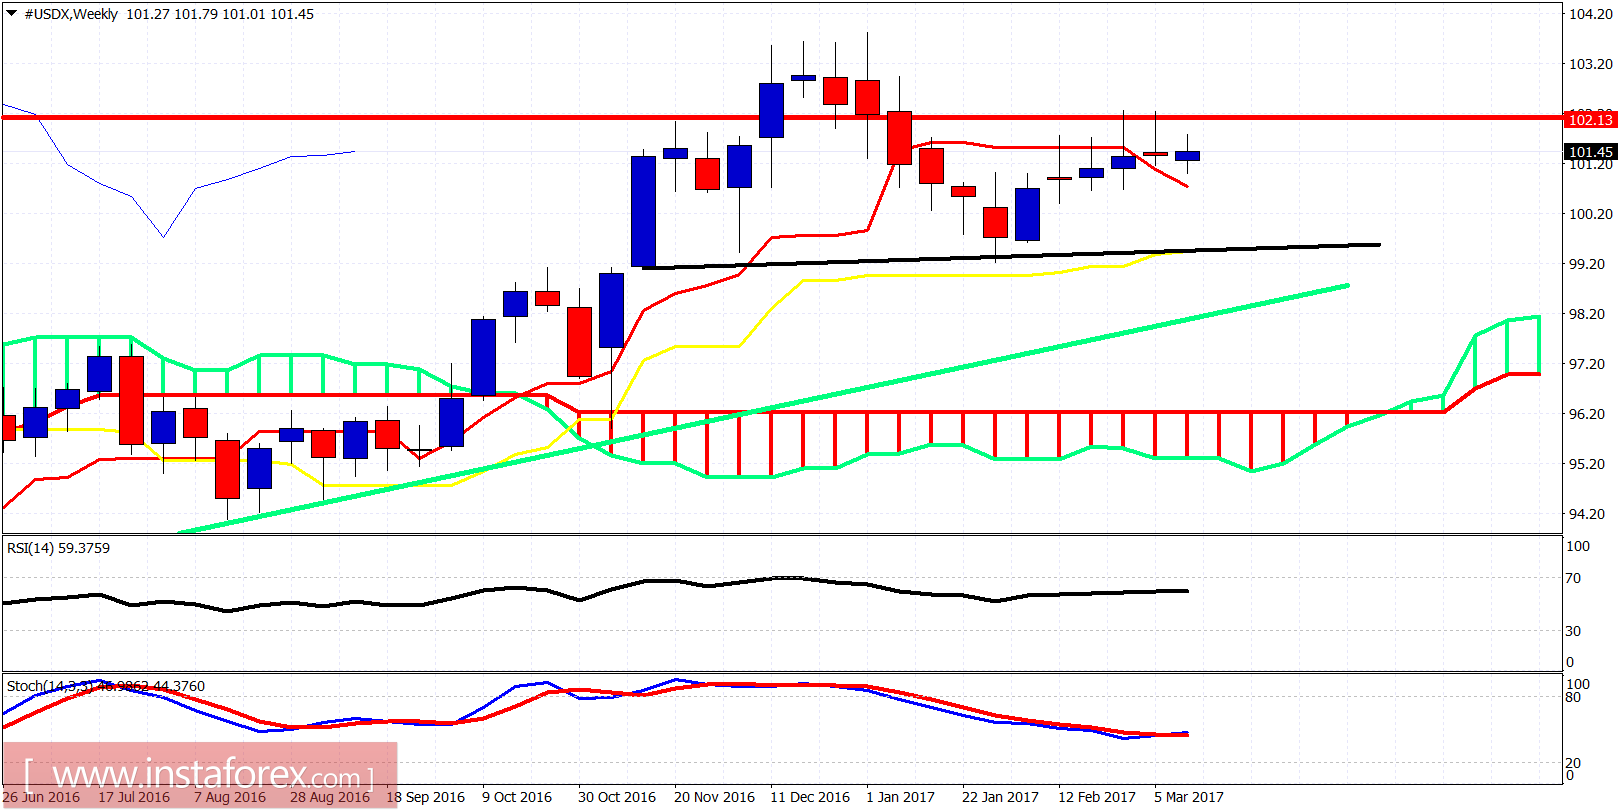
The Dollar index remains below important resistance of 102.30 but no new lows on a weekly basis. Important weekly support is at 100.60, so a weekly close below it will open the way for a push lower towards 99 or even lower. Bulls need to break above 102.30 for the new highs scenario to remain valid.


