


Overview:
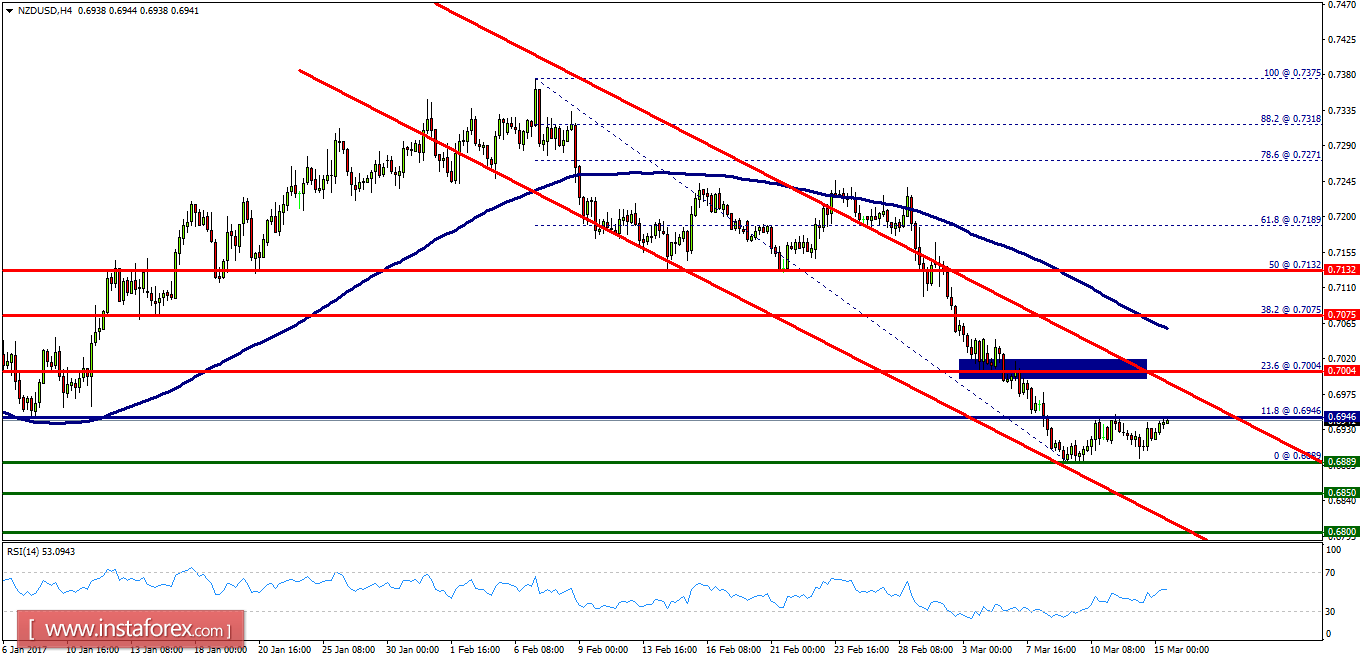
- The NZD/USD pair was trading around the area of 0.6946 - 0.6889 for a while.
- Today, the level of 0.6946 represents the double top on the H4 chart.
- The pair has already formed minor resistance at 0.6946 and the strong resistance is seen at the level of 0.7004 because it represents the weekly resistance 1.
- So, major resistance is seen at 0.7004, while immediate support is found at 0.6889.
- If the pair closes below the price of 0.6889, the NZD/USD pair may resume its movement to 0.6850 to test the daily support 2. We expect the NZD/USD pair to move between the levels of 0.6946 and 0.6850.
- Equally important, the RSI is still calling for a strong bearish market. The current price is also below the moving average 100.
- As a result, sell below the double top of 0.6946 with targets at 0.6869 and 0.6850.
- However, stop loss should always be taken into account; accordingly, it will be good to set the stop loss above the last bullish wave at the level of 0.7004.


