


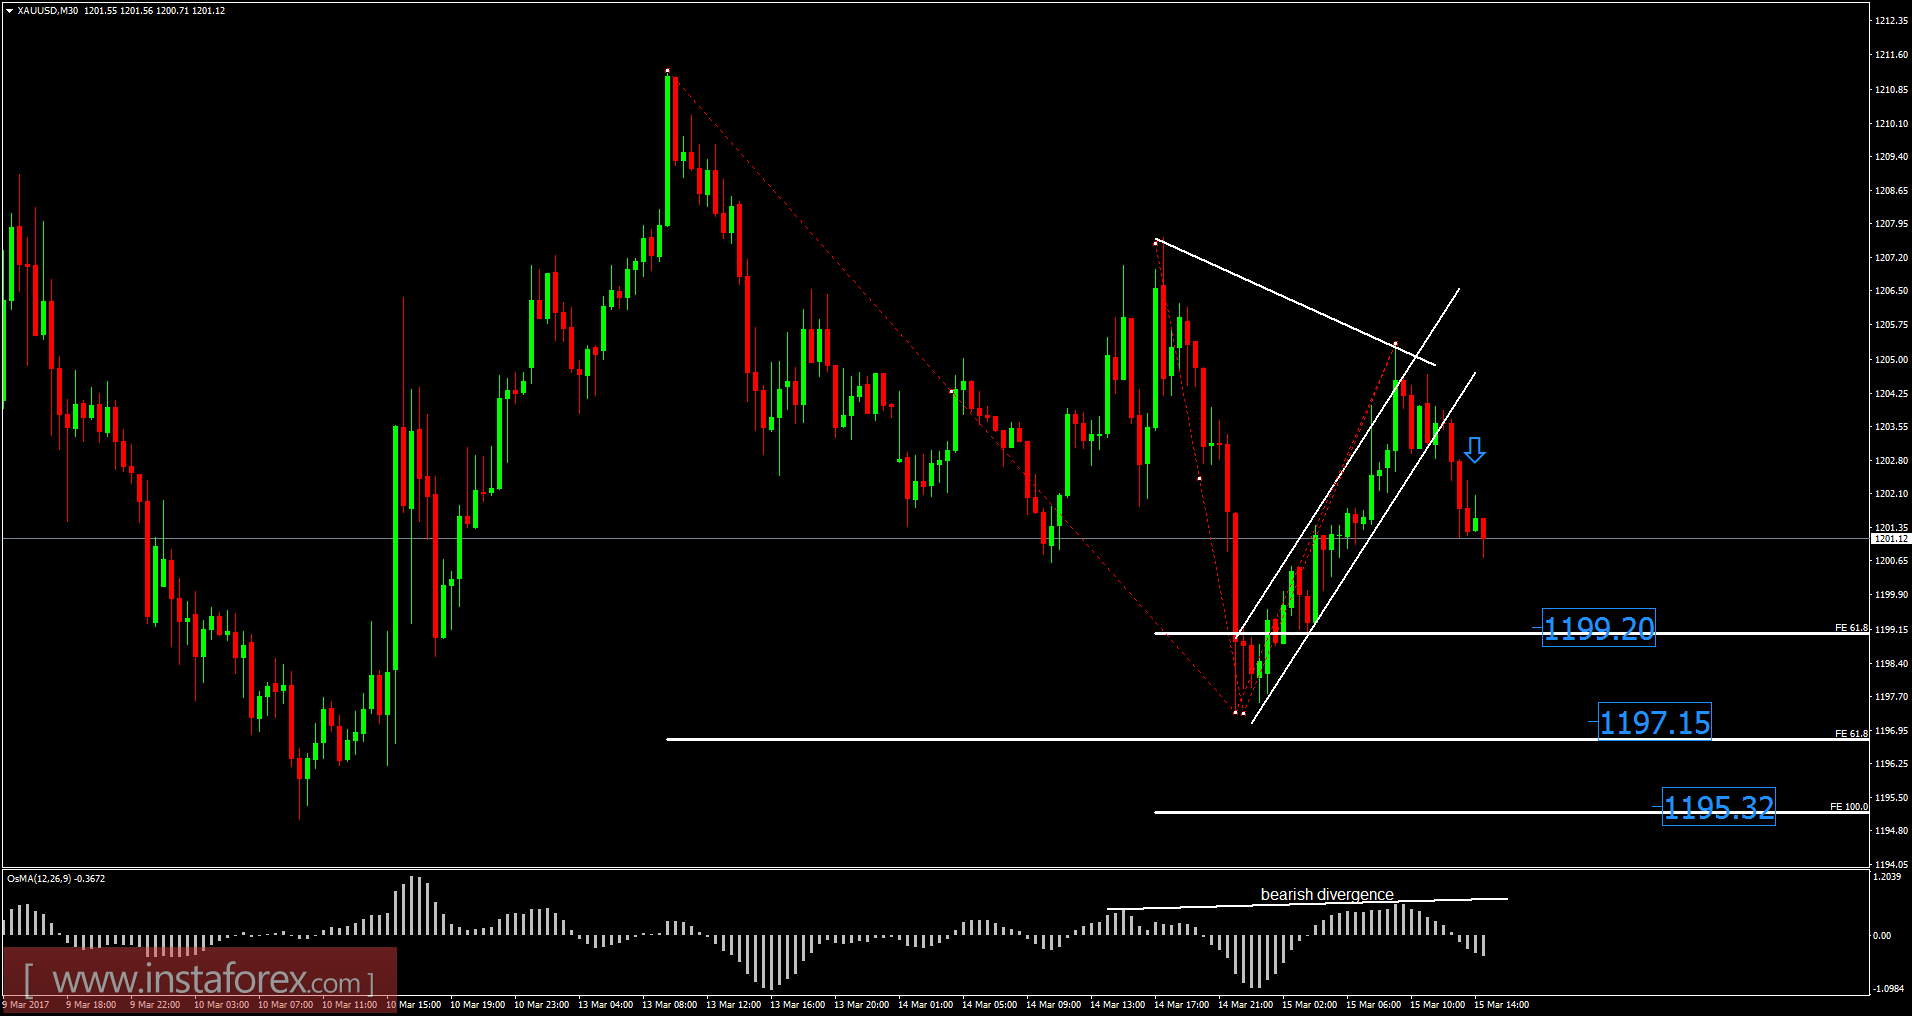
Recently, Gold has been trading sideways around the price of $1,200. According to the 30M time frame, I found a broken upward channel (bearish flag), which is a sign that buying looks risky. I have placed Fibonacci expansion to find potential downward targets. I got Fibonacci expansion 61.8% at the price of $1,199.00-$1,197.15 and Fibonacci expansion 100% at the price of $1,195.30. My advice is to watch for potential selling opportunities. There is also a bearish divergence on the moving average oscilator, which is another sign of weakness.
Resistance levels:
R1: $1,205.00
R2: $1,207.00
R3: $1,210.60
Support levels:
S1: $1,198.00
S2: $1,195.50
S3: $1,192.40
Trading recommendations for today: watch for potential selling opportunities.


