


The Dollar index got hit very hard yesterday. As I mentioned in my previous analysis, last night the FOMC was widely expected to trigger higher volatility. The Dollar index was giving bearish signals for the last few days and we have pointed them out very clearly over the last few days.
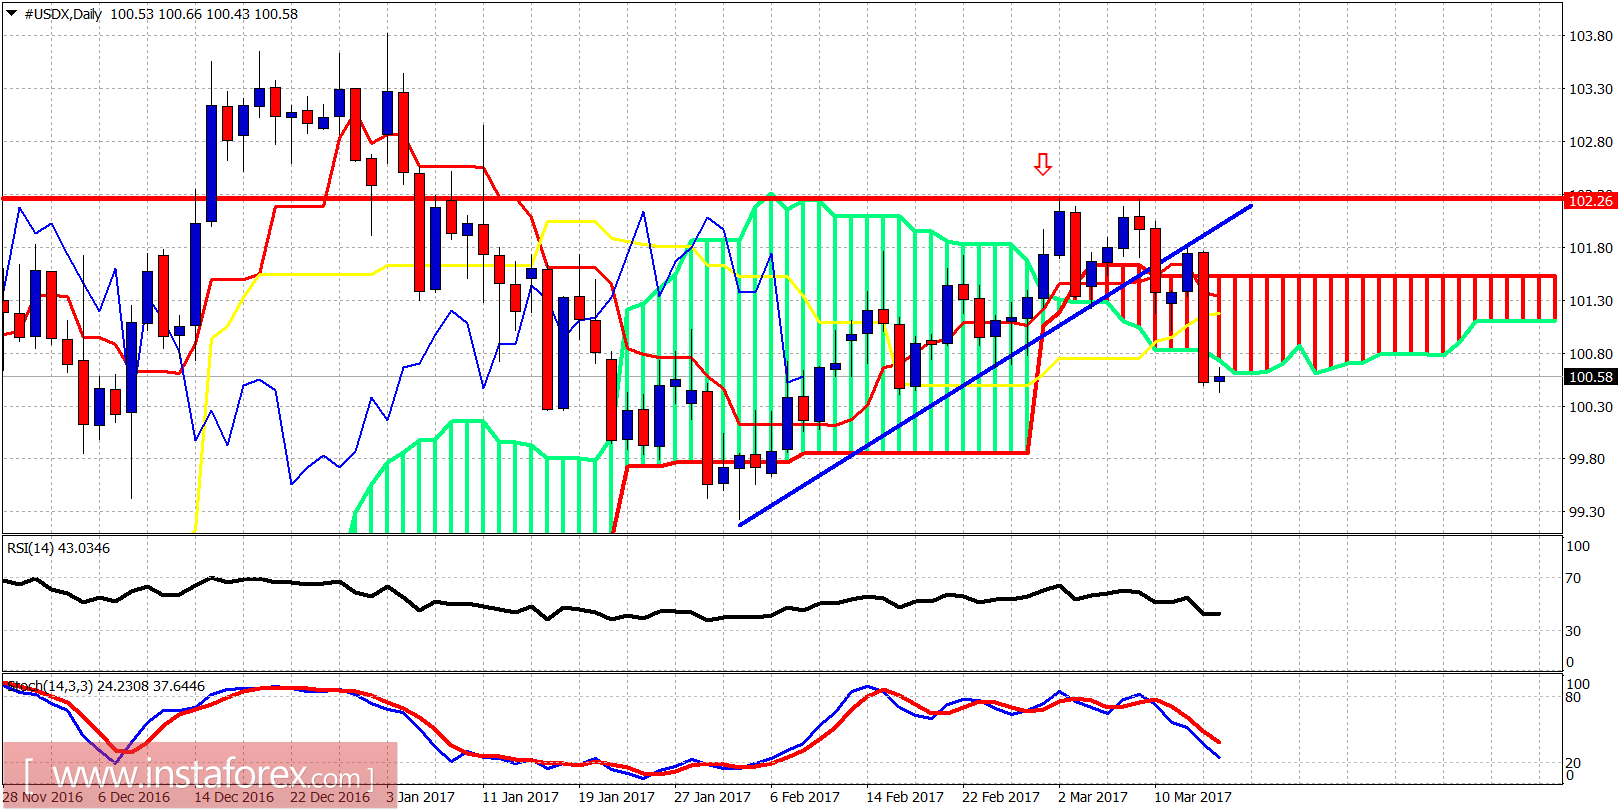
Blue line - support
As we have mentioned in our previous analysis, the Dollar index was giving bearish signals once price got rejected at the resistance of 102.30 and after making a double top. Price also broke below the blue trend line support and after back testing it, the sell-off after the FOMC decision followed. Price is breaking below the Ichimoku cloud. Dollar bulls need to step in now and support the Dollar, because they want to see a lower high being made, before the breakout above 102.30.
Black line - neckline supprot
Green line - long-term trend line support
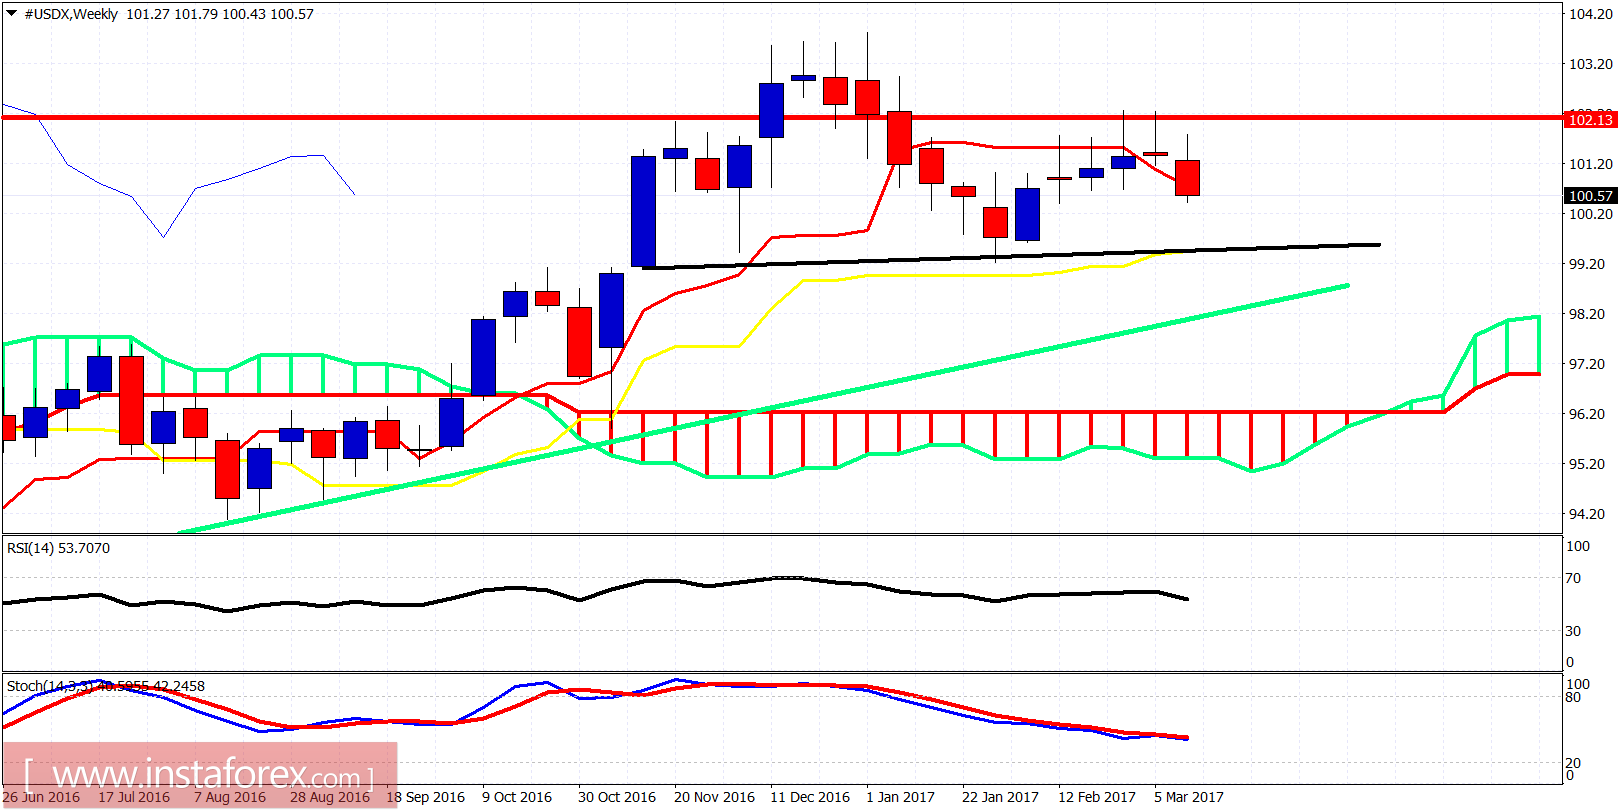
The weekly chart is showing this week's candle is turning lower breaking the lows of the past two weeks. The rejection at 102.30 combined with the downward sloping oscillators and the fact that it is trading below the weekly tenkan-sen, is a very bearish combination. Bulls need to stop the decline now and break above 102.30 to regain control of the trend.


