


The index is gathering some momentum across the board in favor of the bulls, as the Bollinger bands are pointing to the upside. If USDX manages to break above 100.64, then we could expect a testing of the 200 SMA at H1 chart. MACD indicator still is choppy and doesn't show any clear signals of further extension of the upside so far.
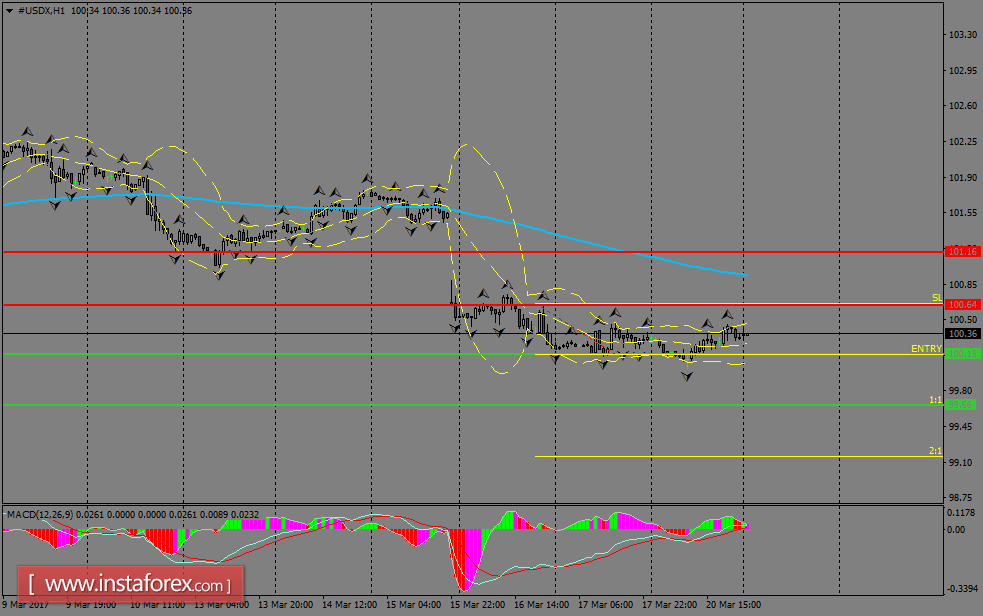
H1 chart's resistance levels: 100.64 / 101.16
H1 chart's support levels: 100.15 / 99.66
Trading recommendations for today: Based on the H1 chart, place sell (short) orders only if the USD Index breaks with a bearish candlestick; the support level is at 100.15, take profit is at 99.66 and stop loss is at 100.64.


