


The Dollar index remains under pressure. Despite some reversal signs yesterday, with its main component of very strong EUR/USD, it is difficult for the Dollar index to move towards our bounce target area of 101. There are still divergence signs in the short term and I still believe we can reach 101.
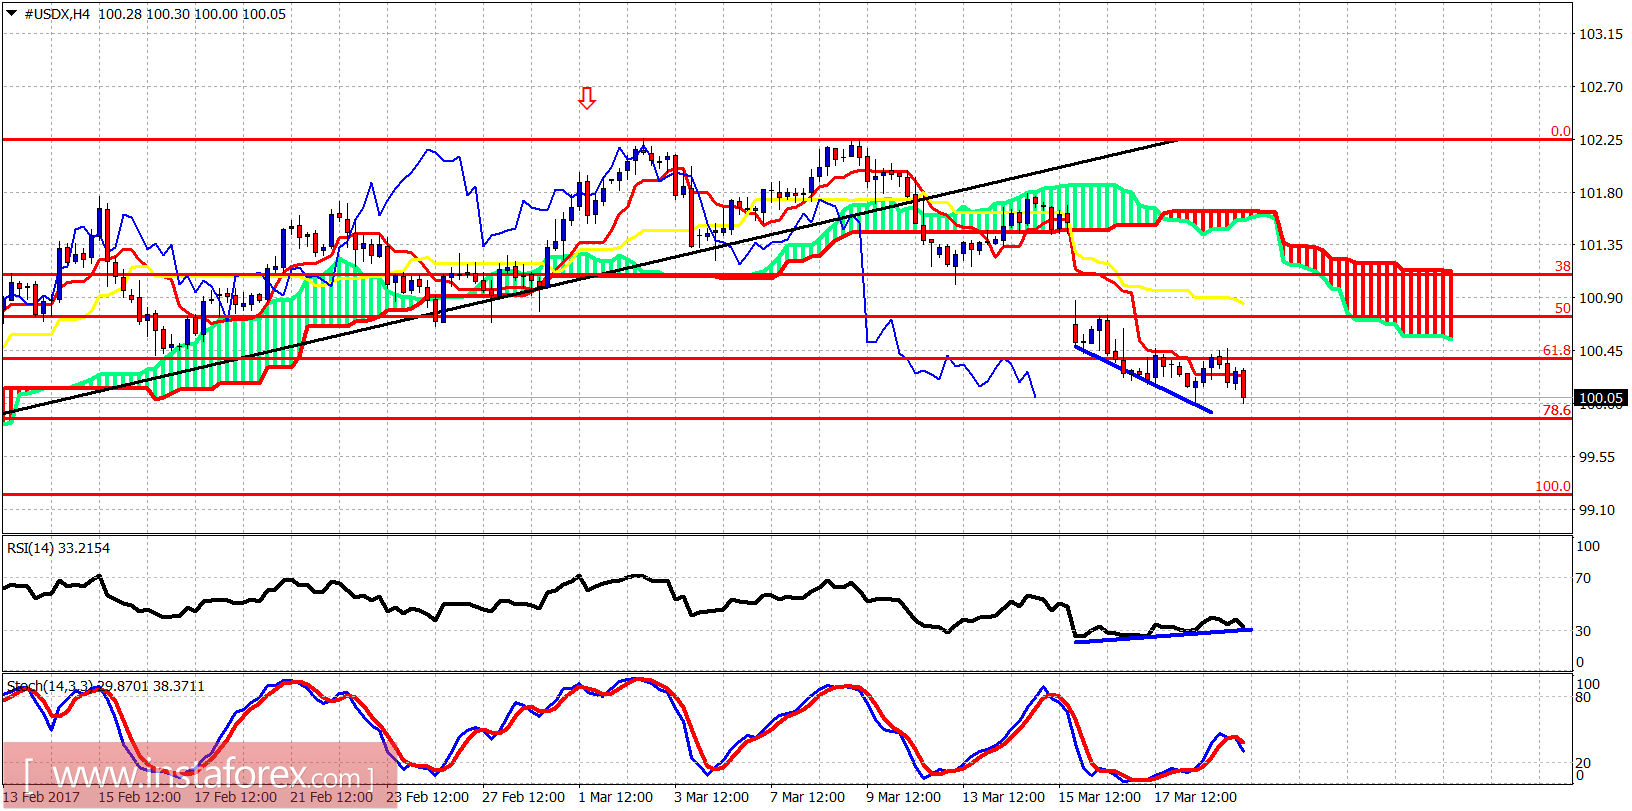
The Dollar index continues to make lower lows and lower highs. Price is below the Ichimoku cloud. The RSI and the Stochastic oscillator are diverging. I prefer to be neutral and wait for the bounce to sell again. More aggressive traders could wait for a break above short-term resistance at 101.46 to go long targeting at least a move towards 101.
Red line - resistance
Green line -long-term support trend line
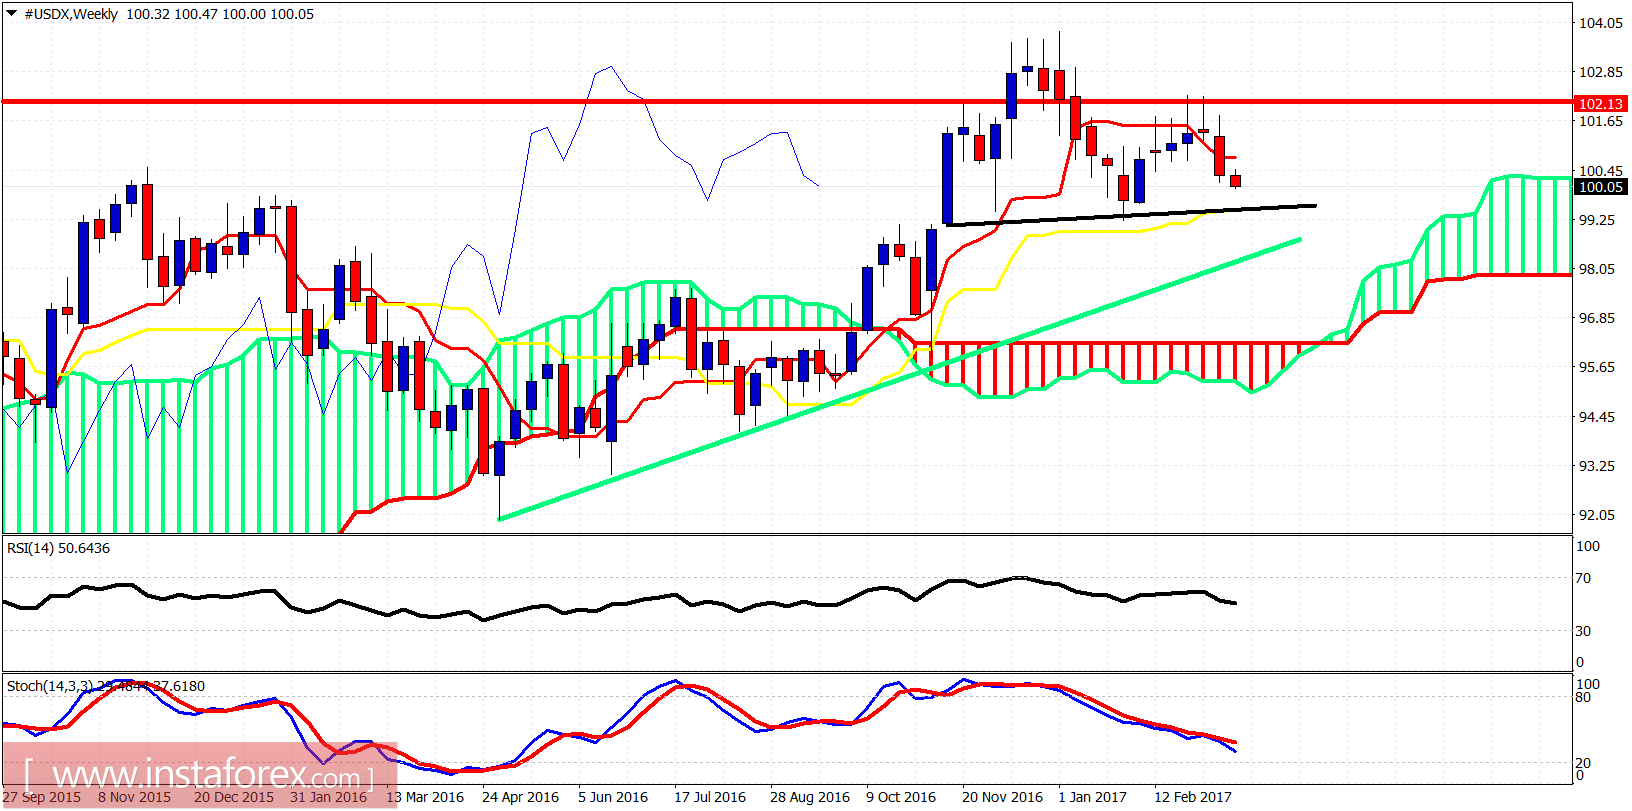
The weekly candle shows me that it wants to test the neckline support. This is very important support because if its is broken, it will enable the Head and Shoulders target of 95. Important long-term support by the green trend line is now found at 97.


