


The index isn't having volatile action and it's headed to test the 100.15 level, as the 200 SMA is approaching that territory. The overall structure remains bearish and as long as USDX continues to consolidate below the 100.00 handle, further declines toward 99.26 are expected to happen in the near-term.
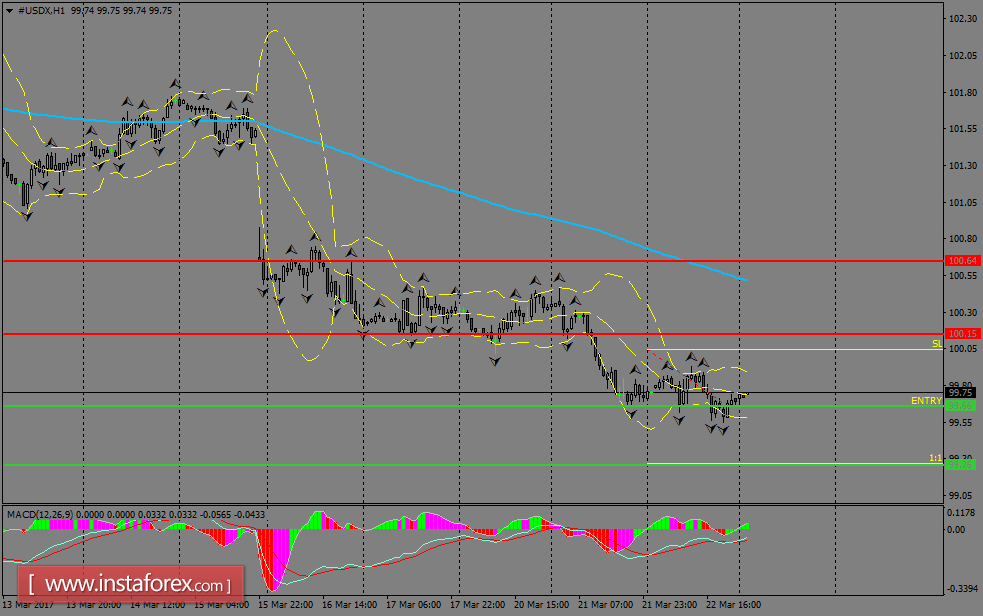
H1 chart's resistance levels: 100.15 / 100.64
H1 chart's support levels: 99.66 / 99.26
Trading recommendations for today: Based on the H1 chart, place sell (short) orders only if the USD Index breaks with a bearish candlestick; the support level is at 99.66, take profit is at 99.26 and stop loss is at 100.04.


