


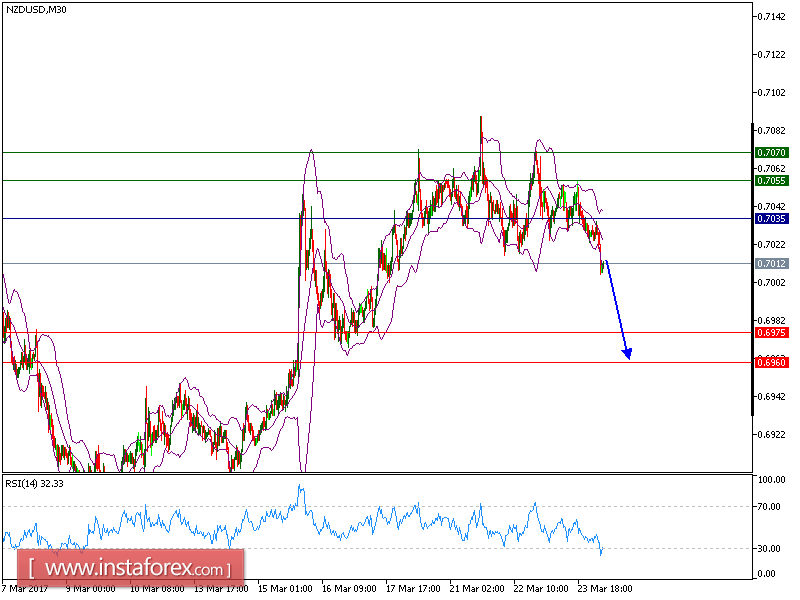
NZD/USD is expected to trade in a lower range. The technical picture of the pair remains negative below its key resistance at 0.7035. The declining 50-period moving average suggests that the pair still has a potential for a further drop. The relative strength index is below its neutrality level at 50 and lacks upward momentum.
As long as 0.7035 holds on the upside, look for a further drop toward 0.6975. A break below this level would call for a further decline toward 0.6960.
The pair is trading below its pivot point. It is likely to trade in a lower range as long as it remains below the pivot point. Short positions are recommended with the first target at 0.6975. A break below this target will move the pair further downwards to 0.6960. The pivot point stands at 0.7035. If the price moves in the opposite direction and bounces back from the support level, it will move above its pivot point. It is likely to move further to the upside. According to that scenario, long positions are recommended with the first target at 0.7055 and the second one at 0.7070.
Resistance levels: 0.7055, 0.7070, and 0.7105
Support levels: 0.6975, 0.6960, and 0.69640


