


GBP/USD still is challenging the resistance zone of 1.2512, where a breakout is likely to happen in the short-term, amid a strengthening of the bulls. When that happens, Cable may attempt a testing of the 1.2570 level, while a pullback can take the pair to reach the 1.2391 zone, where the 200 SMA at the H1 chart is located.
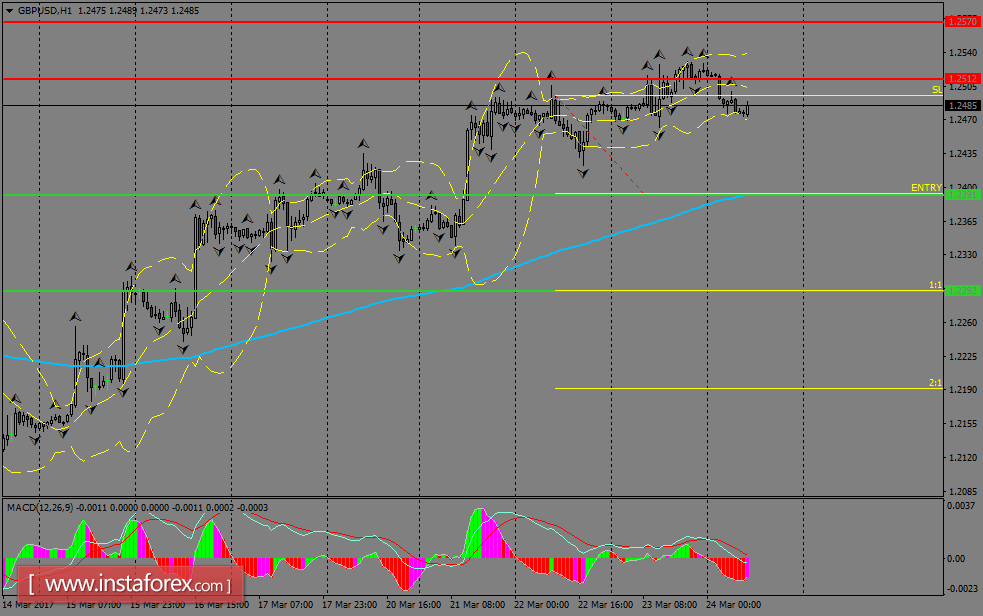
H1 chart's resistance levels: 1.2512 / 1.2570
H1 chart's support levels: 1.2391 / 1.2292
Trading recommendations for today: Based on the H1 chart, sell (short) orders only if the GBP/USD pair breaks a bearish candlestick; the support level is at 1.2391, take profit is at 1.2292 and stop loss is at 1.2493.


