


USDX remains in the weakness' path, as the price action is currently consolidated below the 200 SMA and the Bollinger bands are pointing to the downside. With a breakout below the support zone of 98.98, we may expect further weakness in order to test the 98.29 level. MACD indicator is in the positive territory, favoring the bulls side, but it should be limited by the resistance zone of 99.80.
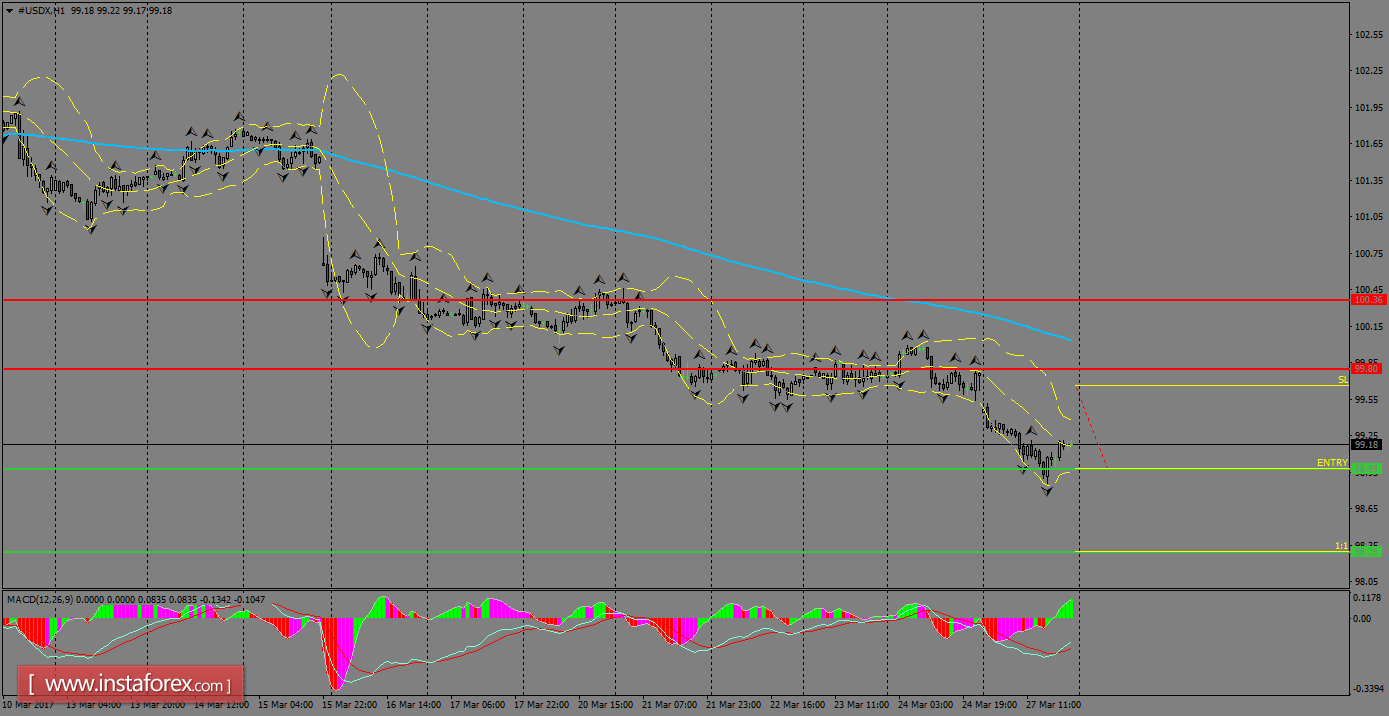
H1 chart's resistance levels: 99.80 / 100.36
H1 chart's support levels: 98.98 / 98.29
Trading recommendations for today: Based on the H1 chart, place sell (short) orders only if the USD Index breaks with a bearish candlestick; the support level is at 98.98, take profit is at 98.29 and stop loss is at 99.66.


