


The Dollar index made a short-term shallow bounce yesterday and it seems it is not ready yet for a bigger bounce towards 101. Trend remains bearish in the short term.
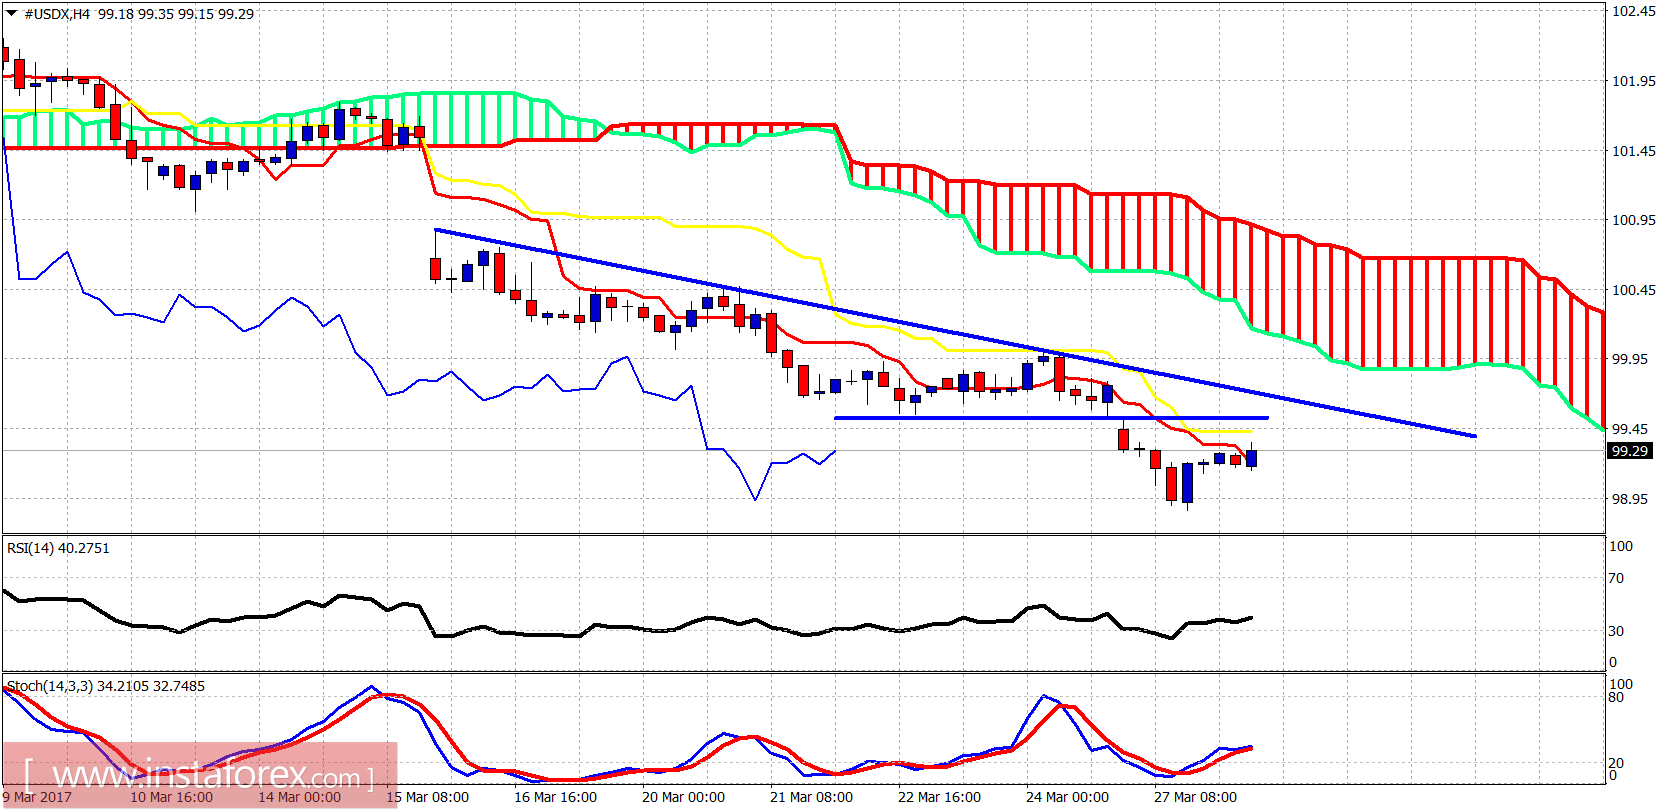
The 4-hour chart shows us how the price is trying to move above both the tenkan- and kijun-sen indicators (red and yellow lines). The price remains below the 4-hour cloud resistance confirming trend is bearish. Short-term resistance is at 99.50-99.70.
Green line -long-term support
Blue line- resistance
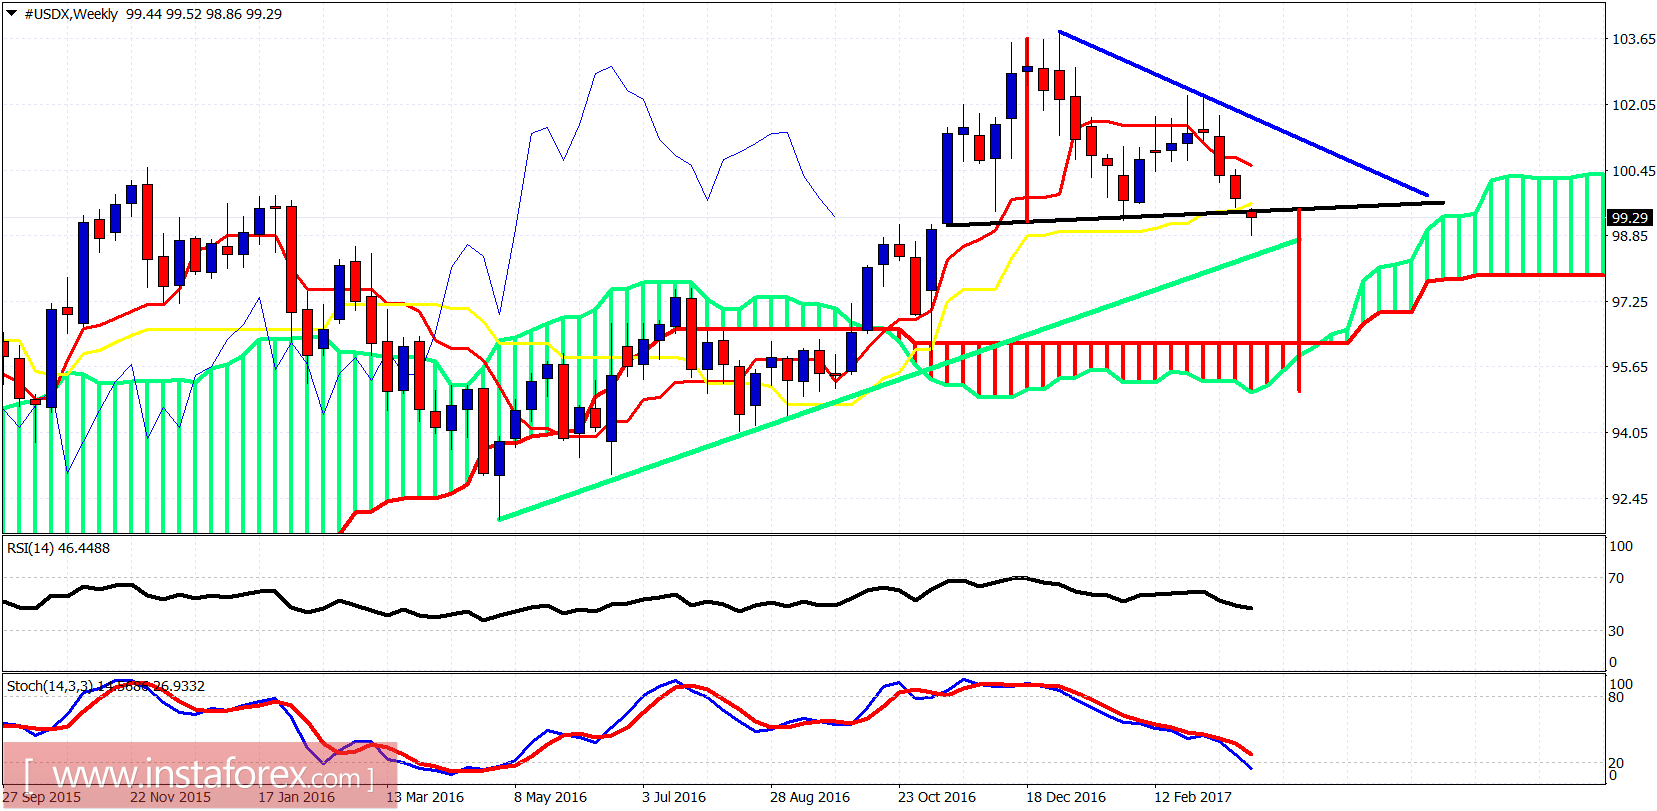
The weekly candle has broken below the neckline support and is now trying to back test and cancel the breakdown. I remain bearish; the index is looking for at least to test the long-term green trend line support at 98.50. So far any bounce is considered to be a selling opportunity.


