


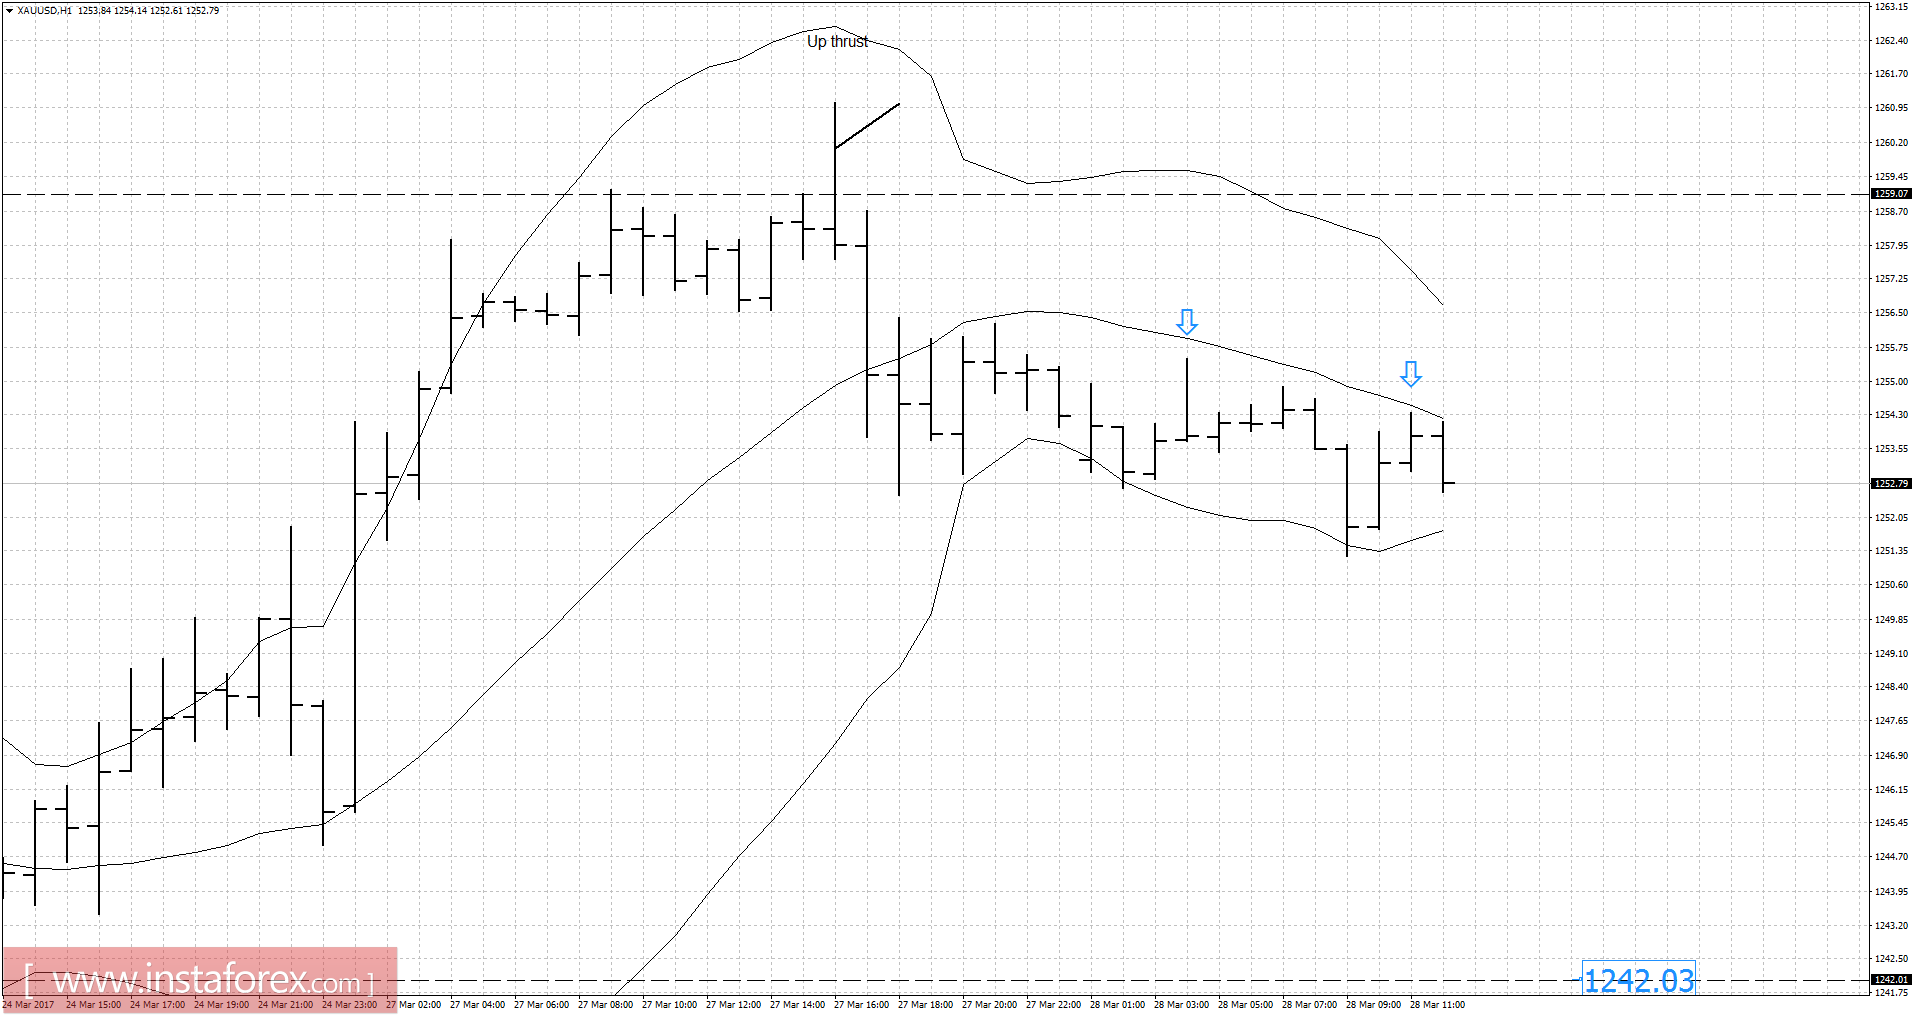
Recently, Gold has been trading sideways at the price of $1,252.00. Anyway, according to the 1H time frame, I found fake breakout of the previous high and up-thrust bar, which is a sign that buying looks risky. My advice is to watch for potential selling opportunities. The price is respecting middle of the Bollinger Bands, which is a sign that Gold changed trend dynamically from bullish to bearish. Downward target is set at the price of $1,242.00.
Resistance levels:
R1: $1,257.00
R2: $1,258.00
R3: $1,259.50
Support levels:
S1: $1,255.00
S2: $1,253.20
S3: $1,251.80
Trading recommendations for today: watch for potential selling opportunities.


