


Gold has pulled back towards $1,240 as expected after breaking below and out of the bullish short-term channel. Long-term trend remains bullish and I continue to expect еру price to move towards $1,300-$1,310.
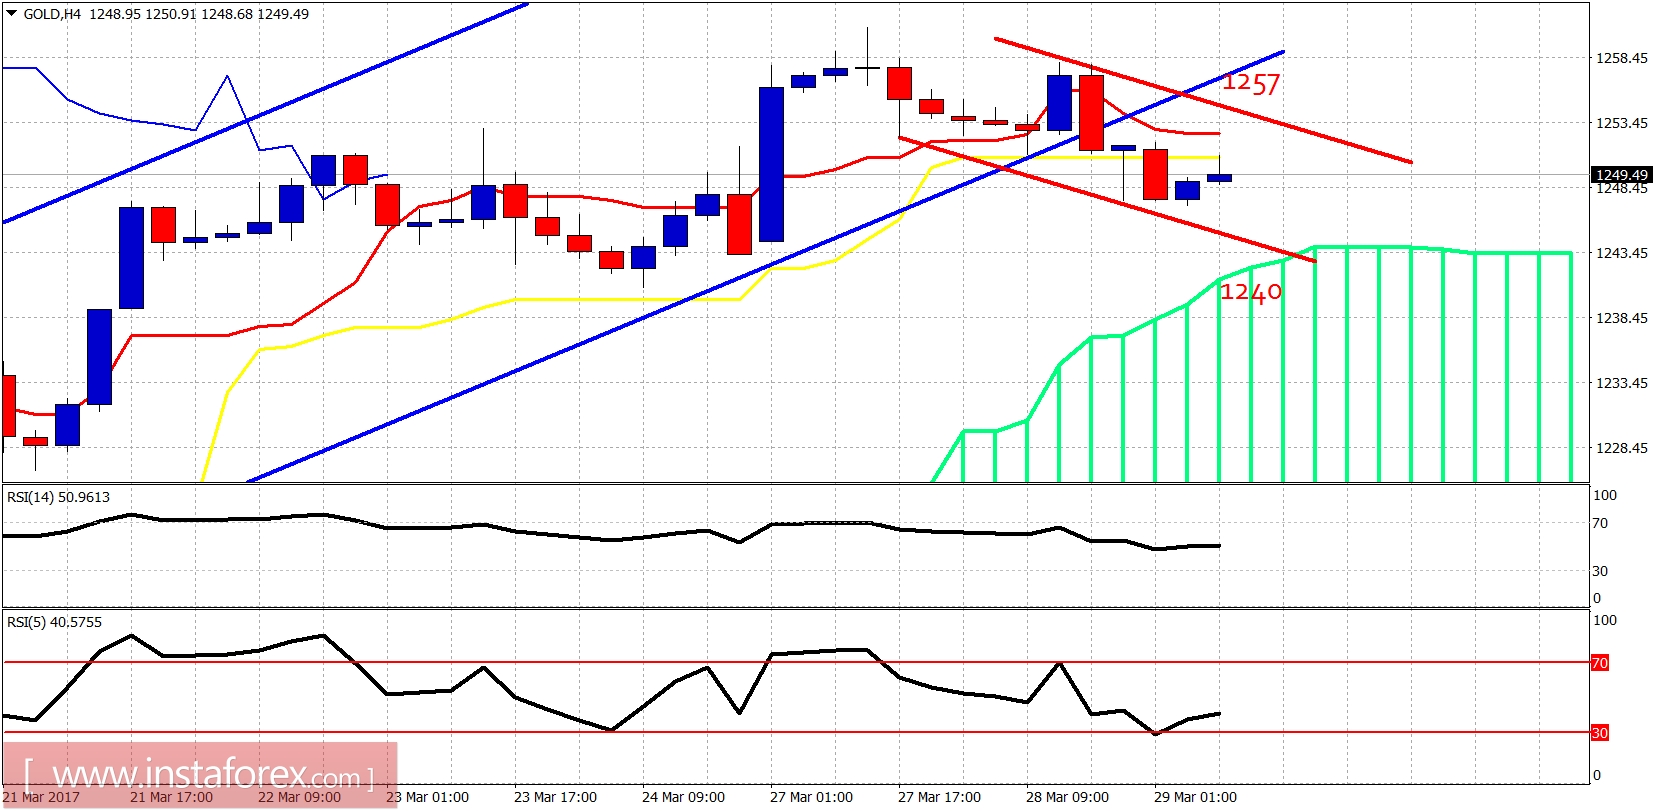
Red lines - bearish channel
Short-term resistance is at $1,257 and the next is at $1,263, at the February's high. Support is at $1,240 in the 4-hour chart by the Ichimoku cloud. The price could drift lower towards $1,240 but overall I continue to see these pullbacks as buying opportunity for Gold.
Blue line - long-term support
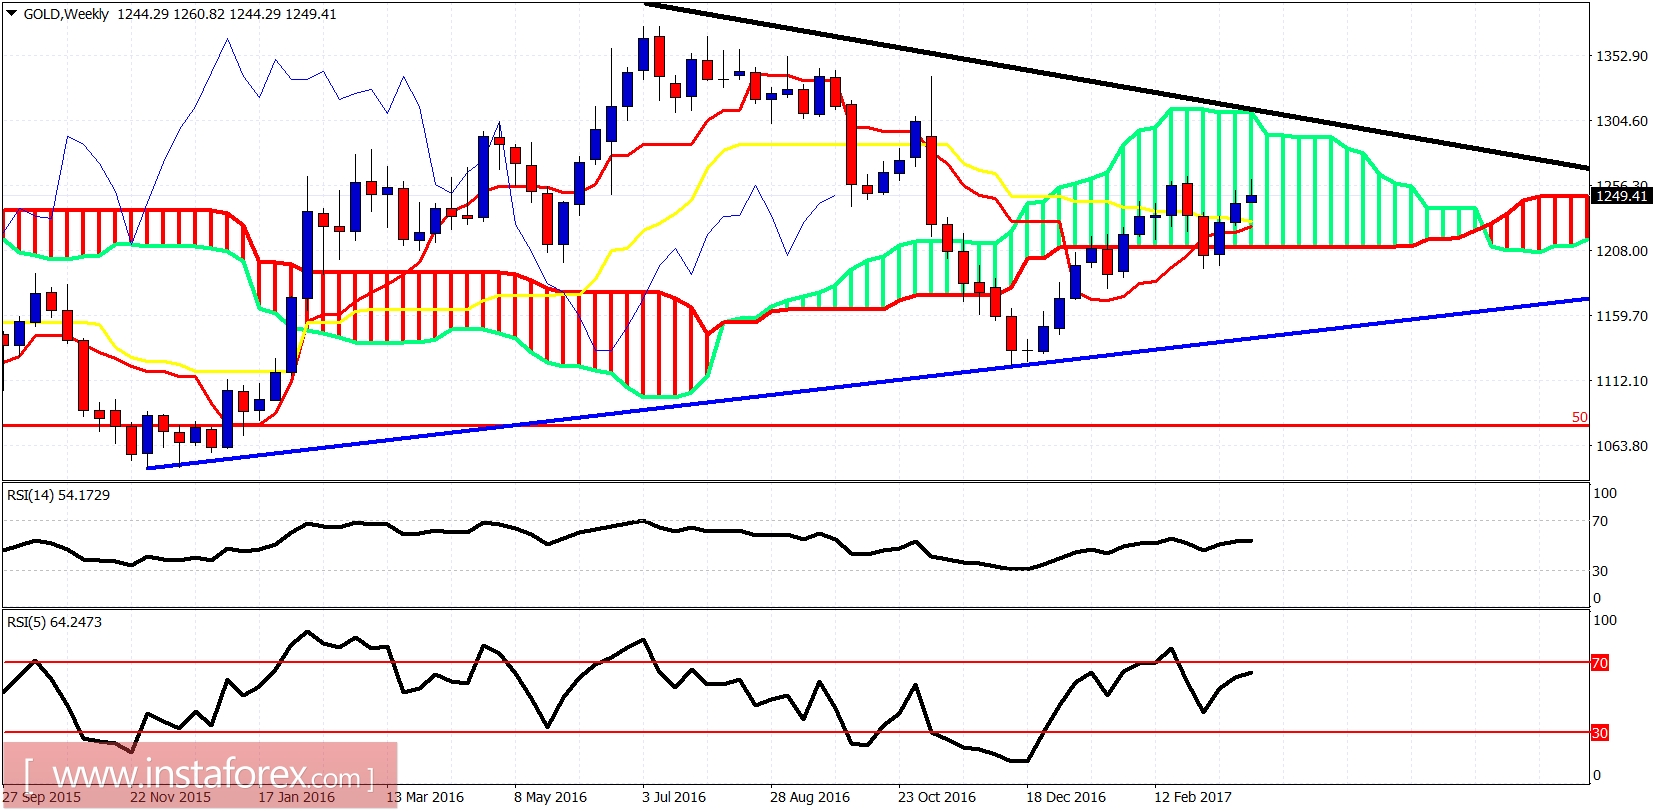
The weekly candle has stopped right below the February high. This is important weekly resistance. Breaking above it will open the way for a move towards the black downward sloping resistance trend line at $1,300-$1,310. Critical support remains at $1,194. If it is broken, the bullish scenario will be in danger as we will have a lot of chances of testing long-term support trend line at $1,150-60.


