


Gold continues trading inside the short-term downward sloping channel. Short-term trend is bearish. We are in a corrective phase inside a longer-term bullish trend, where I expect to see $1,300-$1,310 at least over the coming weeks.
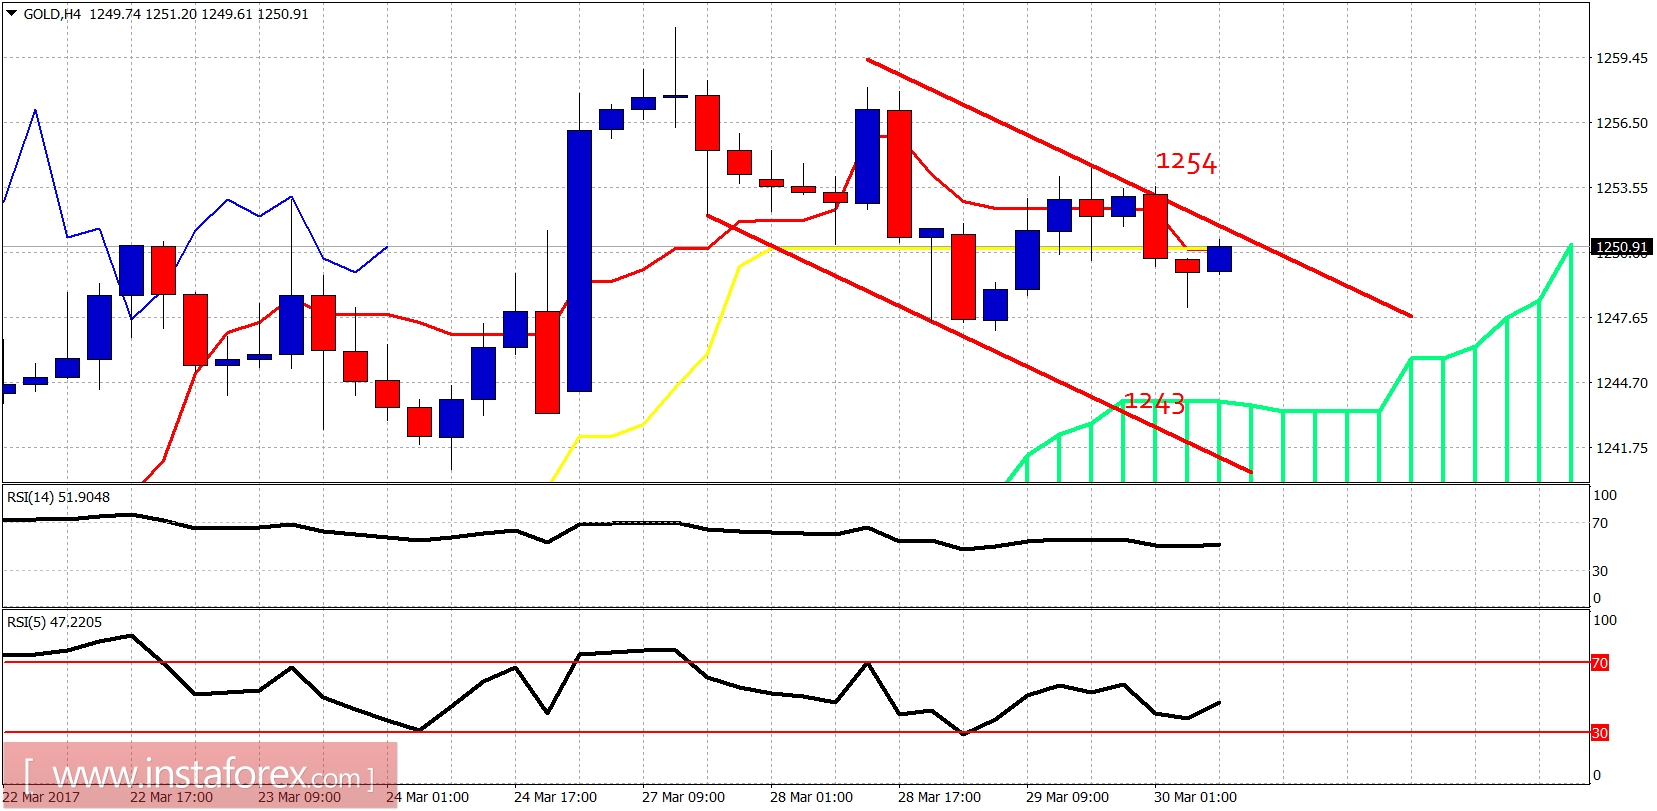
The price is making lower lows and lower highs in the 4-hour chart. The price is trying to break out above the bearish channel. Resistance is at $1,254 and support at $1,243. We could continue lower towards the cloud support but overall my bullish view for a move towards $1,300-$1,310 is unchanged.
Blue line - long-term support trend line
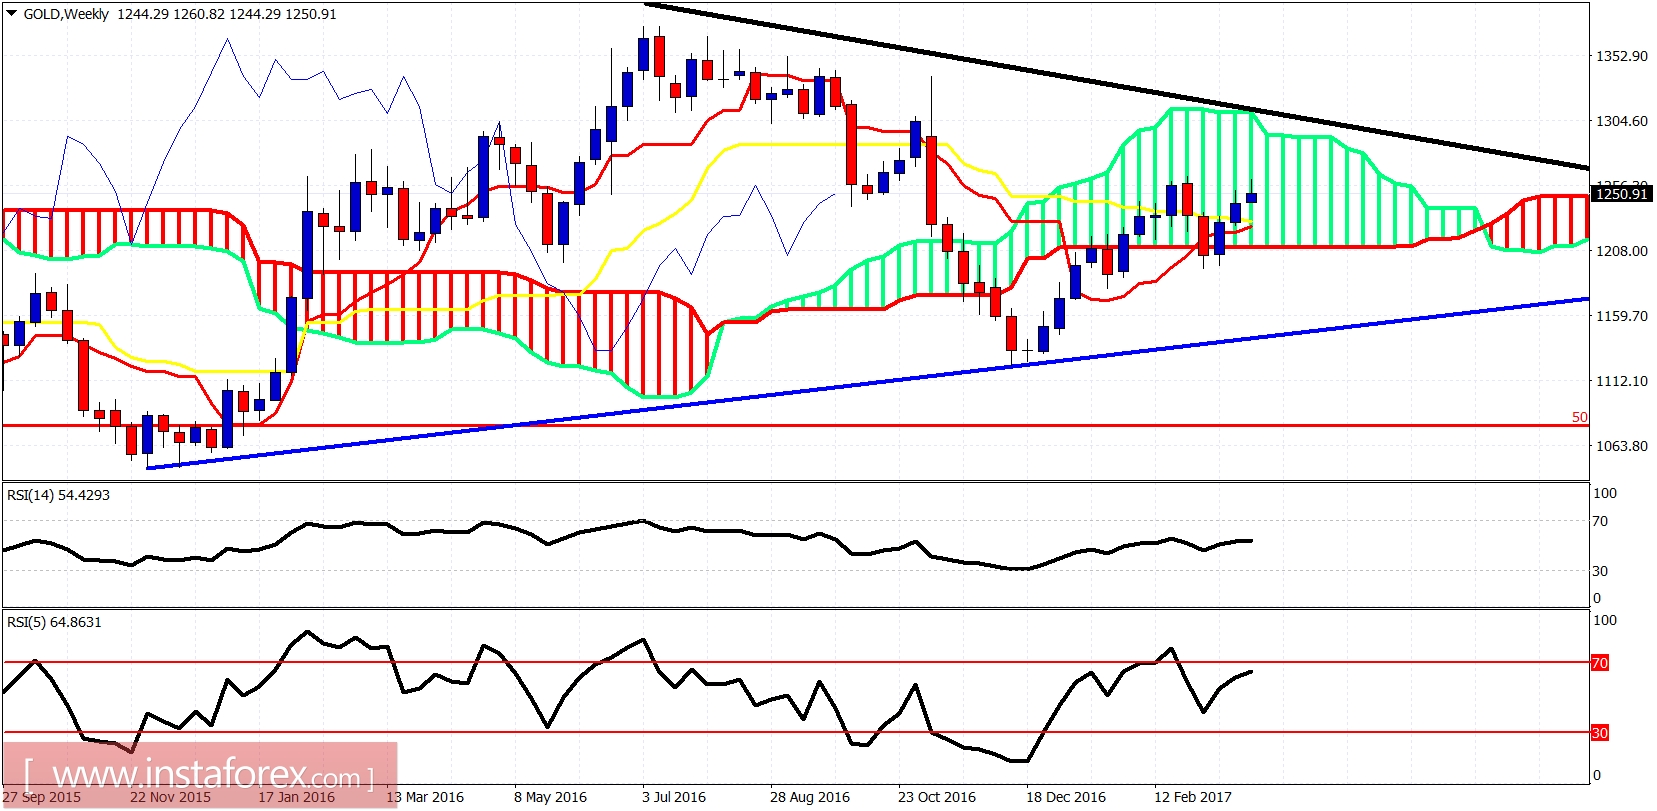
Weekly trend remains bullish. The price is inside the Kumo (cloud) which implies that trend is neutral according to Ichimoku terms. A break above the long-term downward sloping black trend line resistance at $1,310 will be a bullish signal according to Ichimoku. Technically we are already in a medium-term bullish trend and a break above the black trend line will confirm that the longer-term trend is also changing to bullish.


