


The index is extending the bullish bias above the 200 SMA at H1 chart, looking for the next target placed around 100.73. However, the view is still bearish across the board, but with a strong move above 101 we could shift our outlook to a bullish one, while a pullback to break below the key zone of 100.00 should deliver more bearish force toward 99.61.
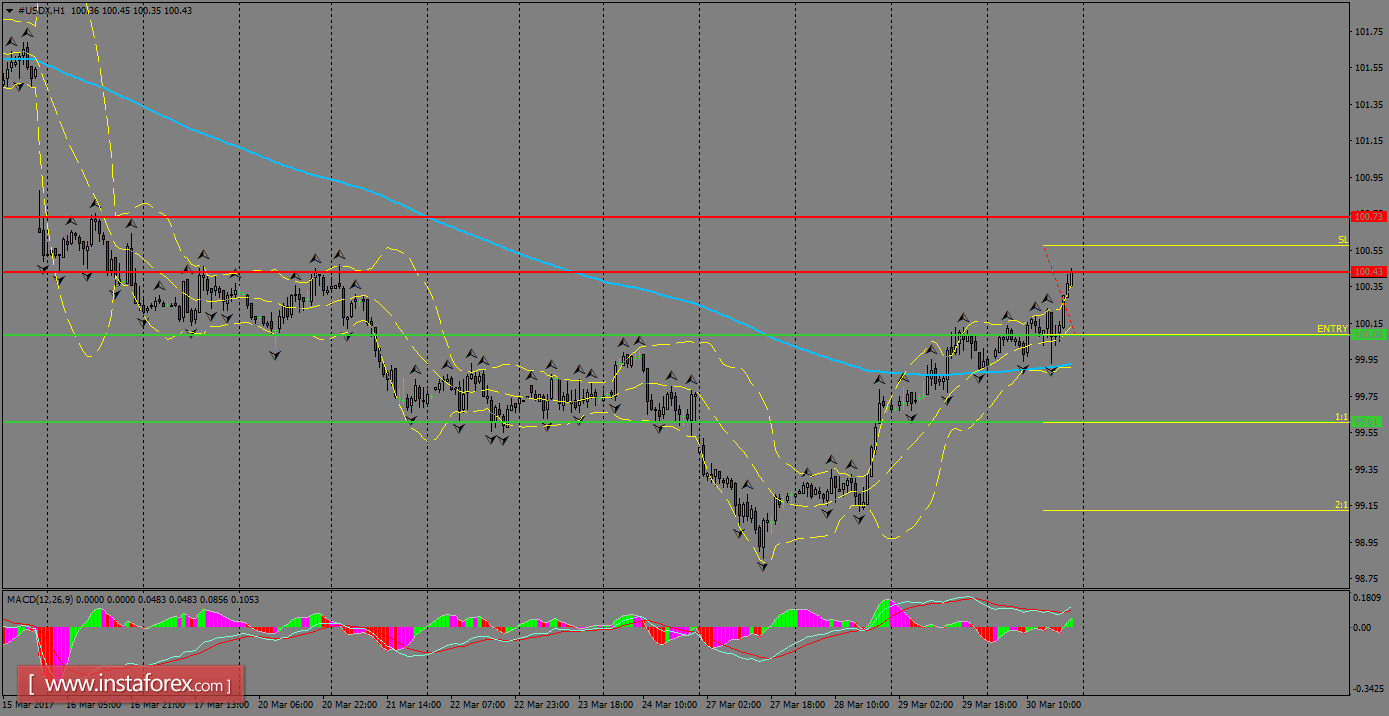
H1 chart's resistance levels: 100.43 / 100.73
H1 chart's support levels: 100.08 / 99.61
Trading recommendations for today: Based on the H1 chart, place sell (short) orders only if the USD Index breaks with a bearish candlestick; the support level is at 100.08, take profit is at 99.61 and stop loss is at 100.57.


