


Yesterday Gold continued the pullback and is trading above $1,240 near the 38% Fibonacci retracement of the latest rise from $1,194 to $1,261. Short-term trend is bearish, but it is expected to reverse soon.
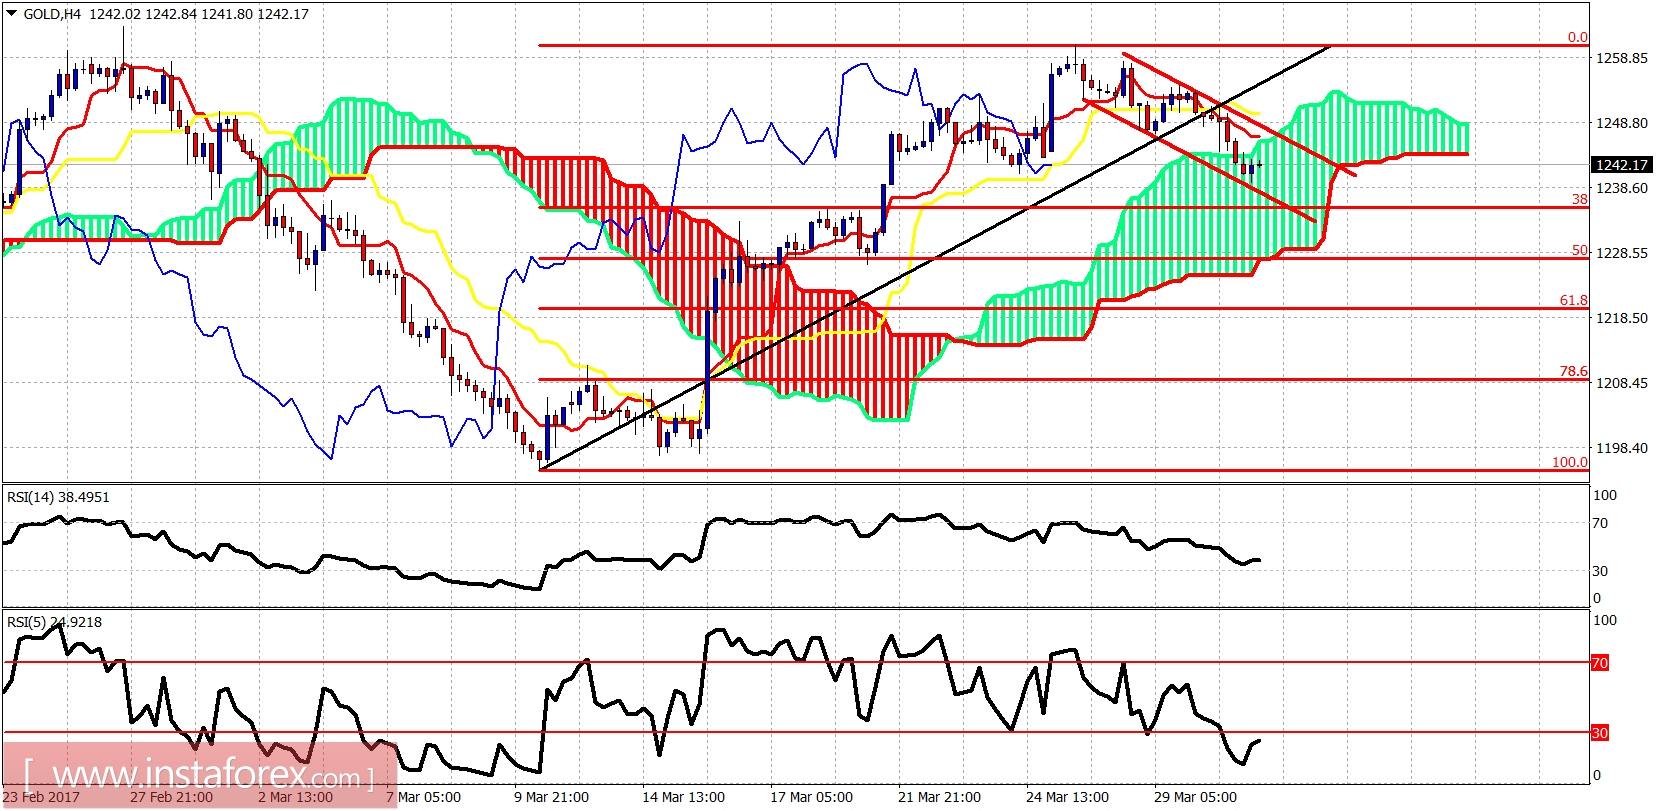
Red lines - bearish channel
The price has entered the 4-hour Ichimoku cloud. This changing trend will back to neutral in the short term. The RSI (5) is telling me that soon we will have an upward reversal. Short-term resistance is at $1,248. Support is at $1,236.
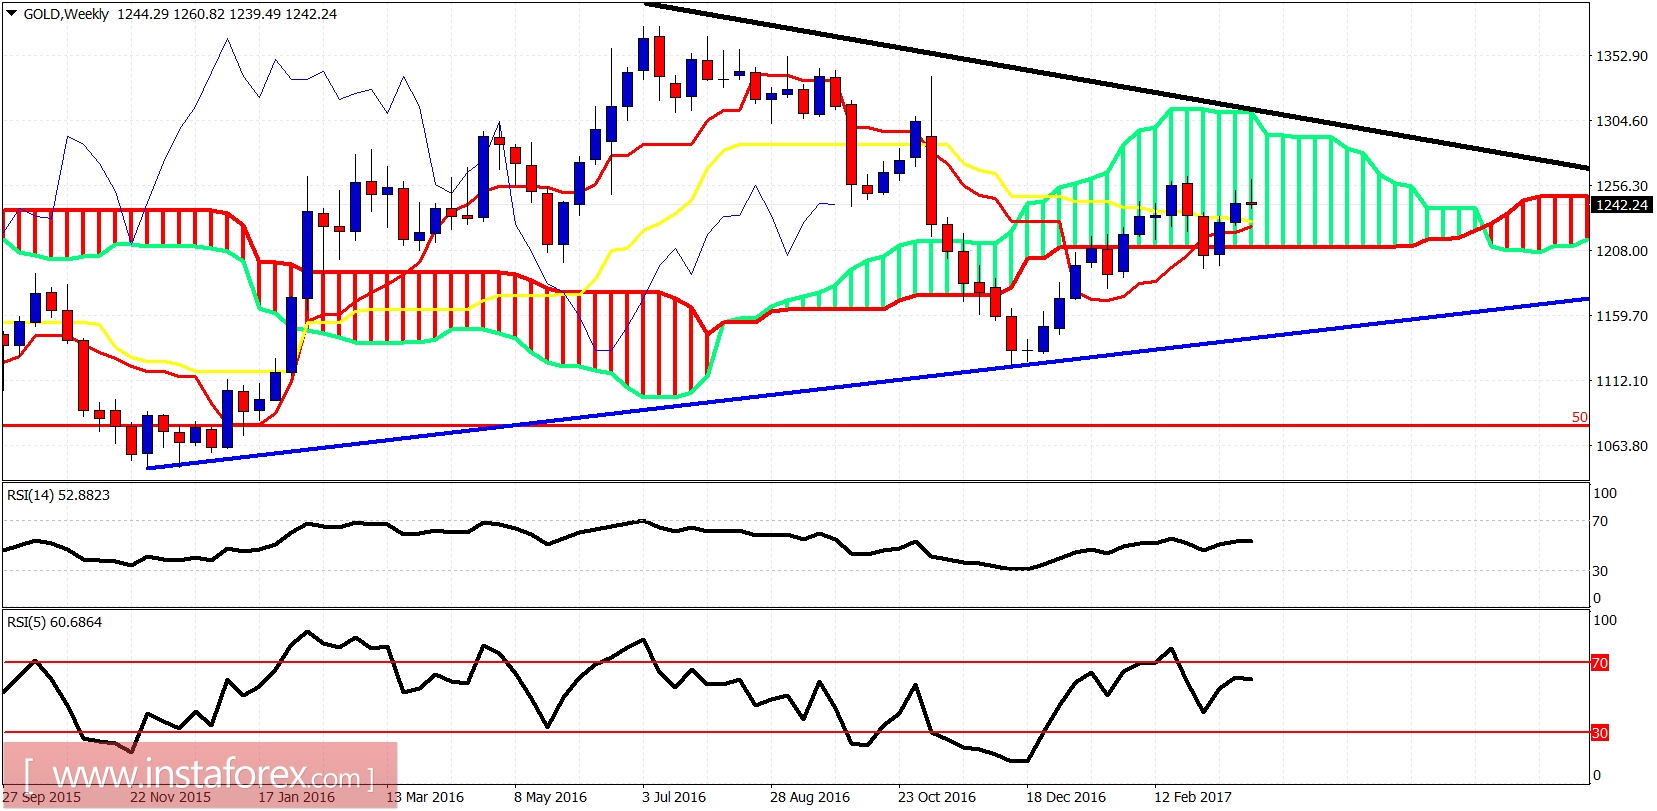
Gold remains above both the weekly tenkan- and kijun-sen. This is a good sign. However, the price needs to break above the black downward sloping trend line resistance and above the cloud at $1,300-$1,310 in order for the weekly trend to be confirmed bullish.


