


The index extended its decline during Tuesday and approached the 200 SMA at H1 chart, where possibly it could start to find dynamic support. If a rebound happens there, we can expect a rally to test the resistance zone of 101.25. The overall structure is still pointing to the upside, but a bullish scenario's invalidation can happen when USDX consolidates below 100.43 in order to reach the 100.00 handle.
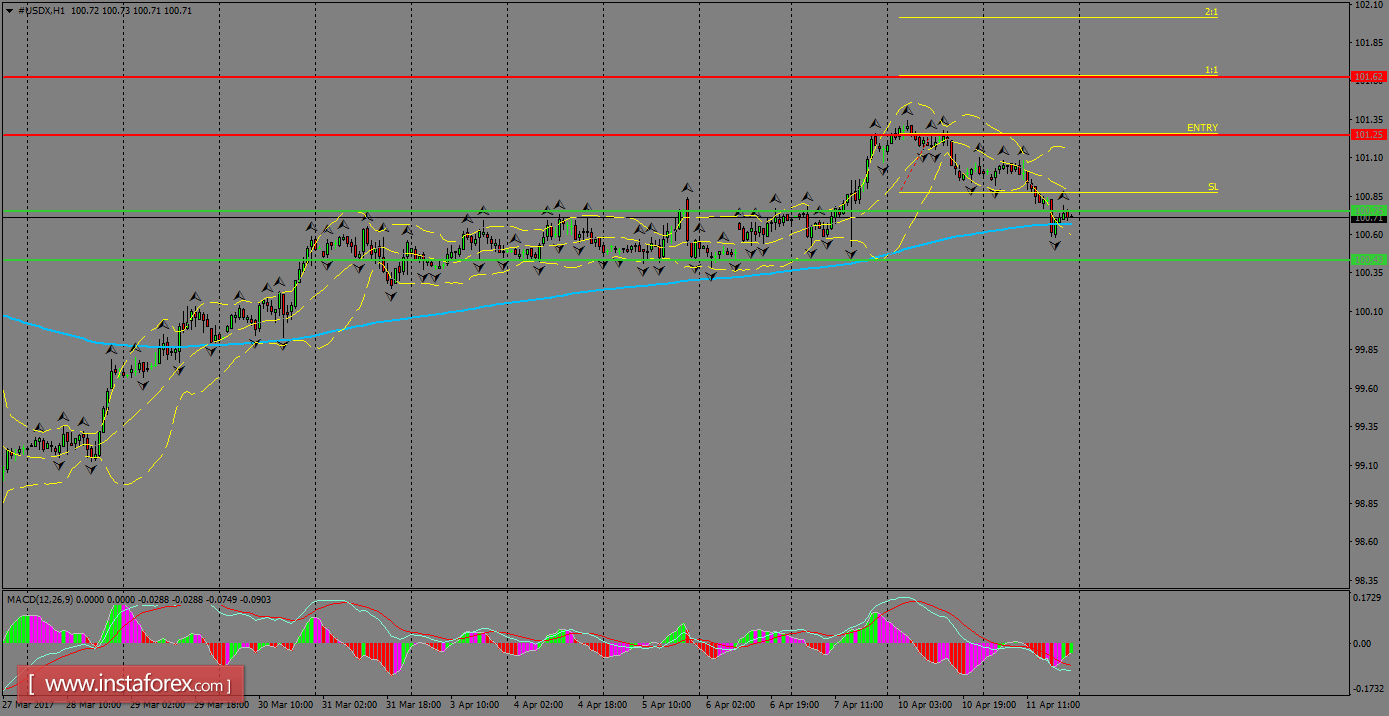
H1 chart's resistance levels: 101.25 / 101.62
H1 chart's support levels: 100.75 / 100.43
Trading recommendations for today: Based on the H1 chart, place buy (long) orders only if the USD Index breaks with a bullish candlestick; the resistance level is at 101.25, take profit is at 101.62 and stop loss is at 100.87.


