


Gold price held support and broke out to new highs towards $1,280 yesterday. The $1,280 level is at the lower boundary of our larger target area from $1,122. Our target area remains at $1,280-$1,320 and I believe we can reach the upper boundary.
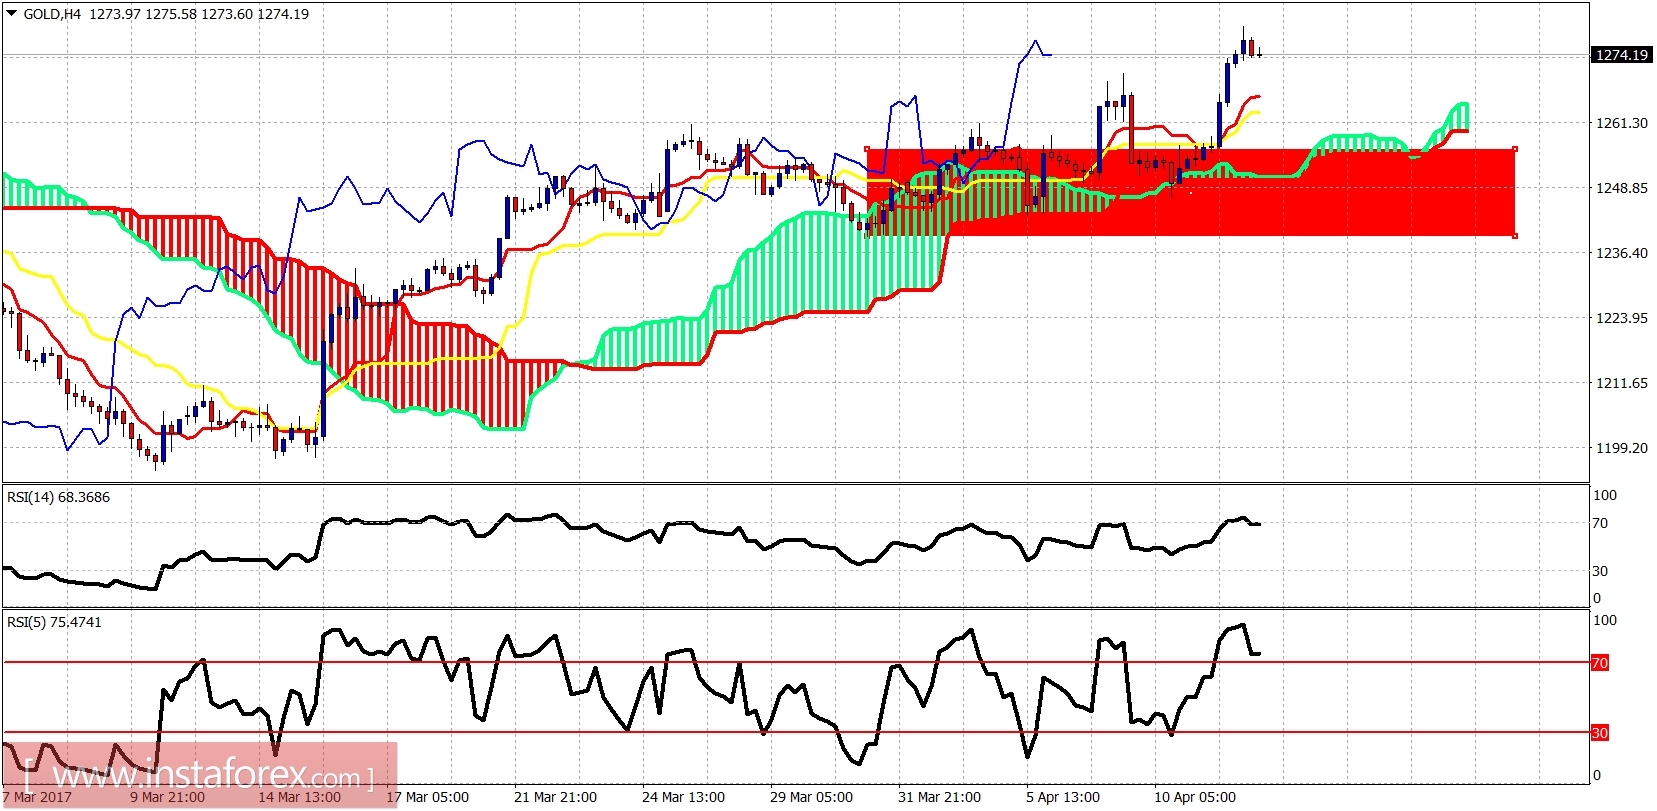
Red rectangle - support area
Gold price is trading above the Ichimoku cloud. There are several warning short-term bearish signals that imply a correction towards $1,260 is justified for the next couple of trading sessions. So I would not be a buyer here but wait for a pullback first. The important support lies at $1,235-45 area but it is not necessary to see such a deep pullback.
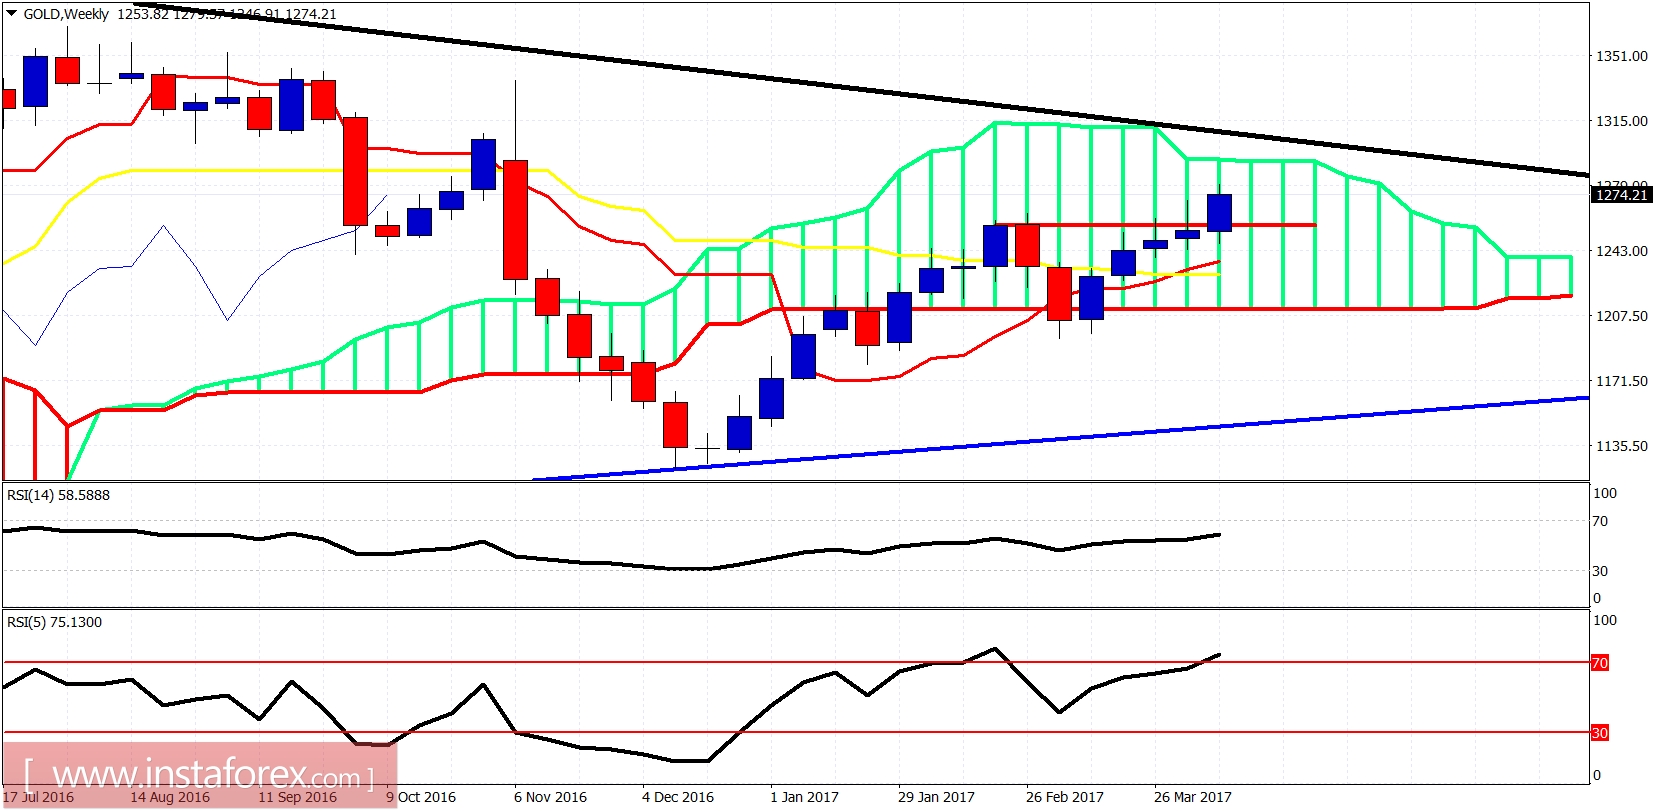
Blue line -support
Black line - resistance trend line
Gold price is breaking above the horizontal trend line resistance and previous highs. This is a bullish indication. I expect gold price to reach the long-term downward sloping black trend line at $1,300-$1,310. Then I would take profits as a strong pullback even towards $1,220-$1,200 would be justified. My longer-term view remains bullish.


