


USDX was heavily sold during Wednesday's session after Trump's comments on the currency, highlighting that it's getting "too strong". After the news, the index plummeted below the 200 SMA at H1 chart and it's finding support around 100.14. The ground seems to be getting prepared for another sellers' wave to test the 99.79 zone.
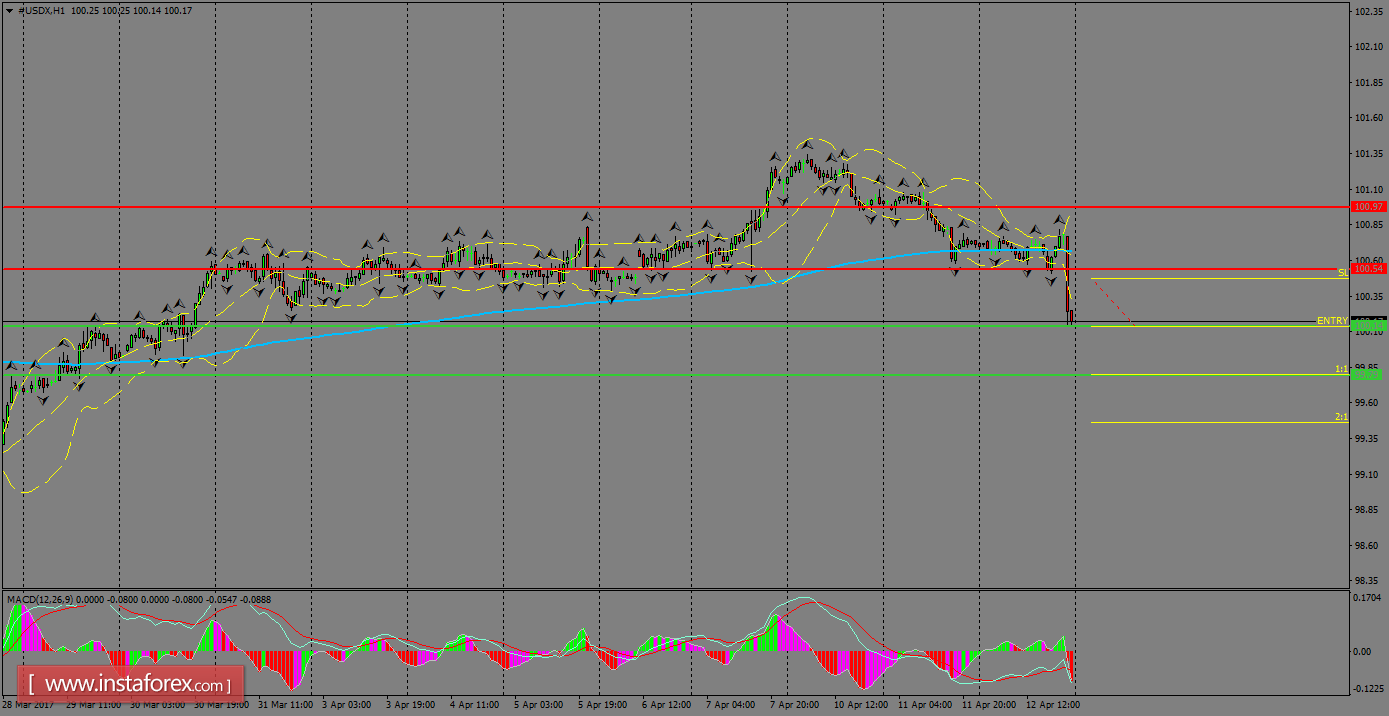
H1 chart's resistance levels: 100.54 / 100.97
H1 chart's support levels: 100.14 / 99.79
Trading recommendations for today: Based on the H1 chart, place sell (short) orders only if the USD Index breaks with a bearish candlestick; the support level is at 100.14, take profit is at 99.79 and stop loss is at 100.47.


